In the past 24 hours, the price of Shiba Inu (SHIB) has slightly decreased by nearly 3%, in line with the downward trend of the entire memecoin market. However, looking at the bigger picture, the situation appears even less favorable.
SHIB has lost more than 17% of its value in the past 30 days, and a series of negative signals are gradually emerging. Nevertheless, there is still a bright spot that could change the situation.
The number of active addresses is close to the lowest level this month
The first warning sign comes from the network itself. According to data from CryptoQuant, the daily active addresses of SHIB have been steadily decreasing and are now close to the lowest level this month, at 3,148, just above the monthly low of 3,130.
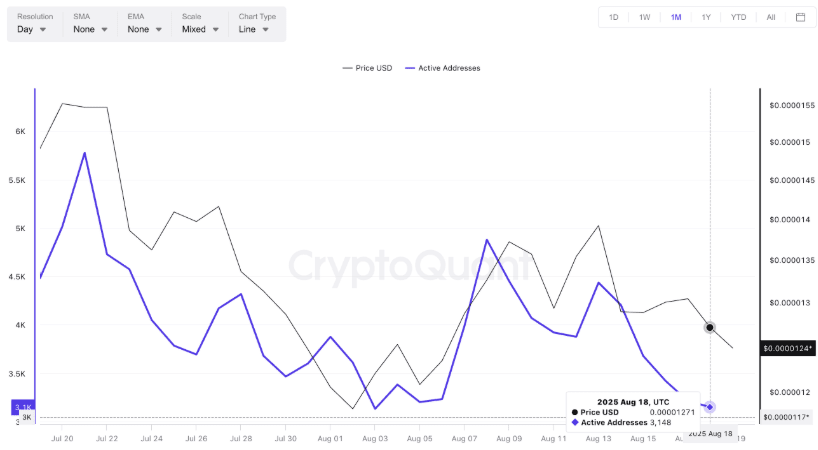
This is a noteworthy signal because in the past, whenever the number of active addresses surged, the price of SHIB usually bounced back immediately afterward. From August 6 to August 8, the number of active addresses skyrocketed, and the price of SHIB reacted almost instantly.
Conversely, the current decline indicates negative sentiment, further reinforced by the Bull-Bear Power (BBP) indicator — which is leaning towards selling, signaling that the bears are gradually gaining the upper hand.
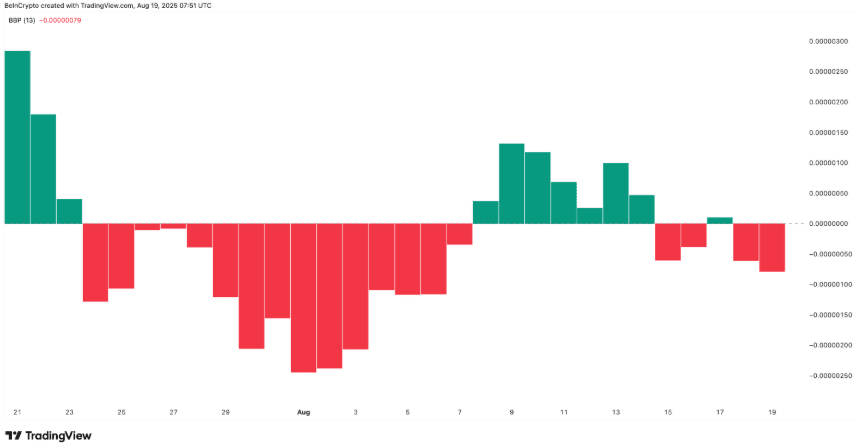
The Bull-Bear Power (BBP) indicator measures the difference between daily highs/lows and the moving average to assess whether bulls or bears are currently controlling price movements.
The whales are quietly accumulating
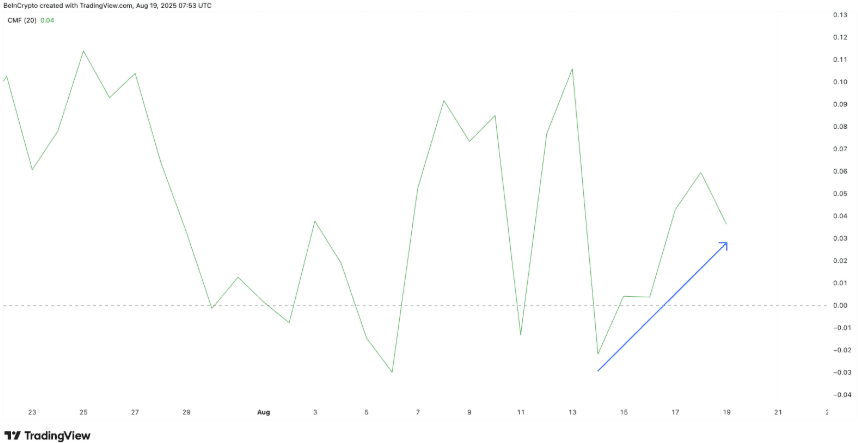
Although signals from the network and price are deteriorating, there is still a positive factor. The Chaikin Money Flow (CMF) indicator remains above 0, indicating that net money flow into SHIB is still positive. This often reflects that large investors are quietly buying while the majority are panic selling.
Technically, CMF creating higher lows means that the inflow of money into this asset is increasing.
Looking more closely, data from Nansen shows that the top 100 wallets have accumulated nearly 21 trillion SHIB in just the past 90 days. This could be the reason why CMF continues to trend upwards, despite the overall negative trend.
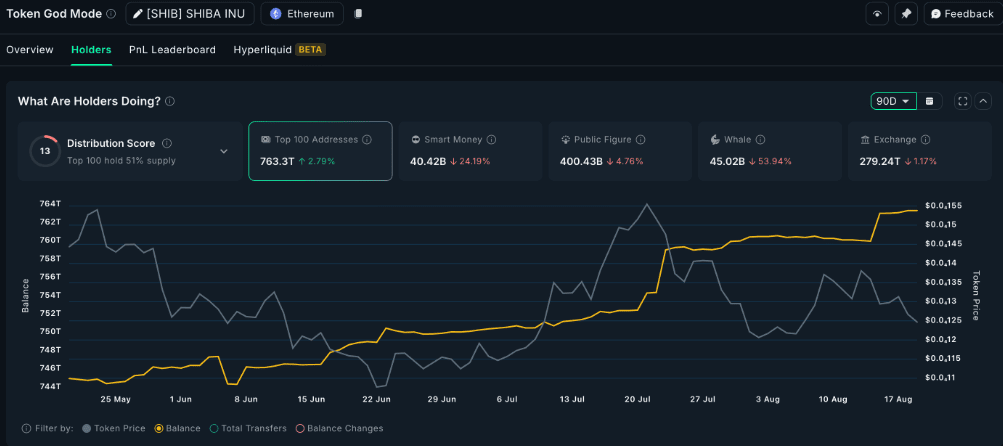
Therefore, while Smart Money and whales have cut their positions, the top 100 addresses continue to increase their holdings.
CMF shows buying or selling pressure by combining price and trading volume; values above 0 indicate accumulation, while values below 0 indicate distribution behavior.
Technical warning: EMA signals stronger correction
On the daily timeframe, technical indicators show a danger signal. The 20-day EMA (red) has crossed below the 50-day EMA (orange) – forming a 'death cross' that often leads to deep corrections.
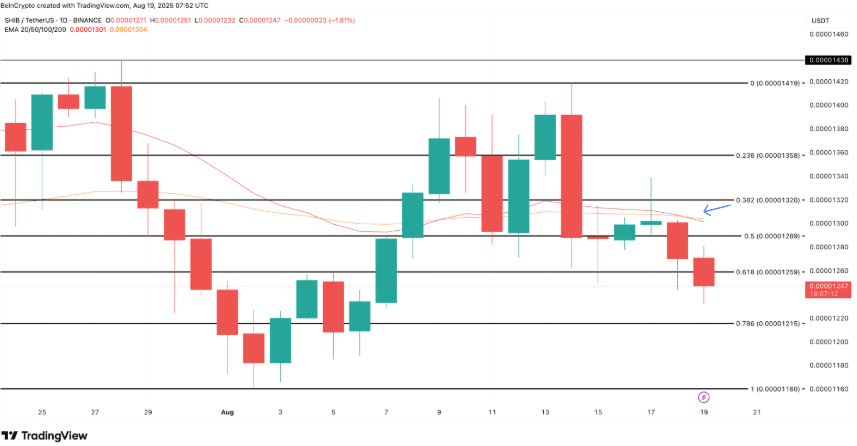
At the same time, the price has pierced through the support zone of $0.00001259 and is currently trading around $0.00001220. If selling pressure continues, the next support zone will be $0.00001215.
If this level is broken, $0.00001160 will become a potential target, marking the possibility of deeper corrections in the next 30 days.
This bearish scenario only becomes invalid if SHIB breaks back above $0.00001320. At that point, the EMA could reverse and restore short-term bullish momentum. But until then, the bearish risk remains dominant.
