
How to manage positions in different market conditions? Homemade position ratio (with illustrations)
I believe many people encounter a problem when trading: not being able to grasp the cycle well.
For example, I am accustomed to trading on the hourly chart, but when there is no profit space on the hourly chart, I want to look for opportunities on the 5-minute chart. Jumping from a larger cycle to a smaller cycle, I still habitually place orders based on the previous position size, which leads to the problem of small gains and large losses. Additionally, I won't control the position and won't know how much position to take each time.
Today, let's learn how to calculate the size of a position, as well as how to use and obtain the free calculator.
1. The transition of trading cycles easily leads to small gains and large losses.
Why is it that despite the profit-loss ratio being constant, the earnings on the 5-minute chart are less than those on the hourly chart?
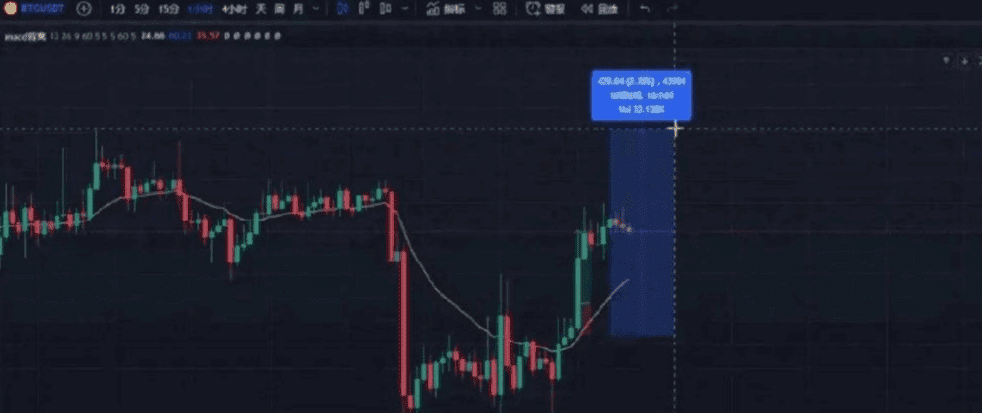
On the hourly chart, we can capture about 400 points with a profit-loss ratio of 1:2, but in the 5-minute chart shown in Figure 2.
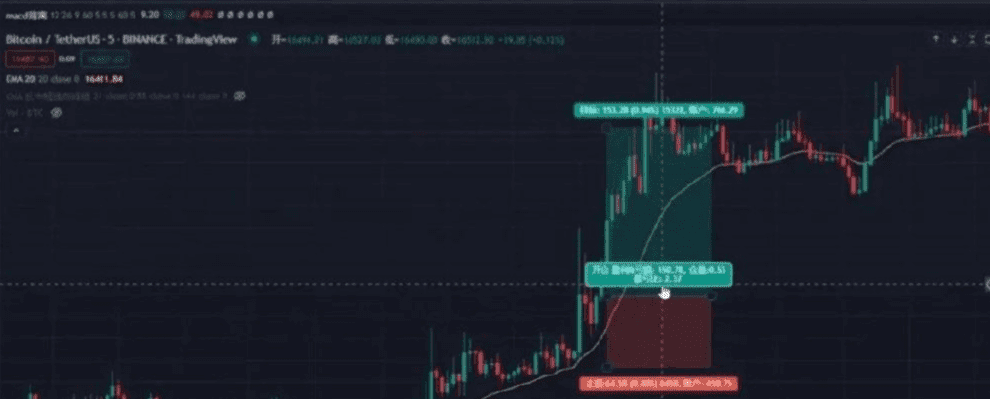
We can only gain 153 points. With the same position size, the money earned from the 5-minute chart and the hourly chart is different. If you switch from the hourly chart to the 5-minute chart, you will end up with small gains and large losses.
2. Position Management
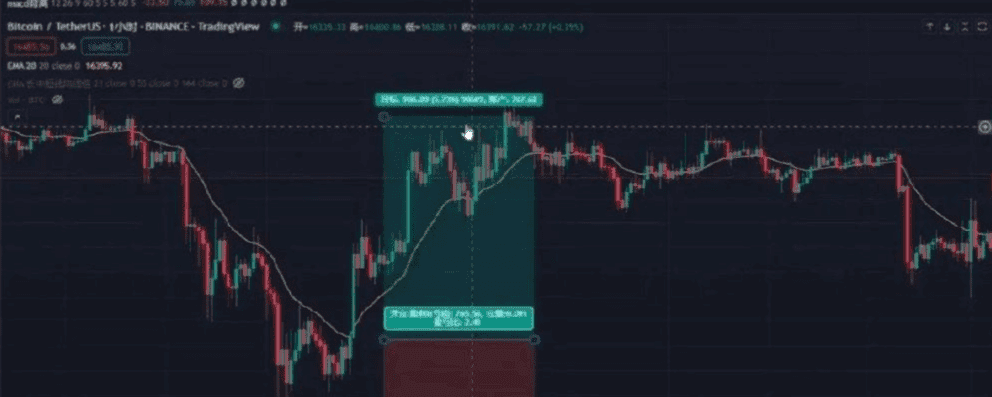
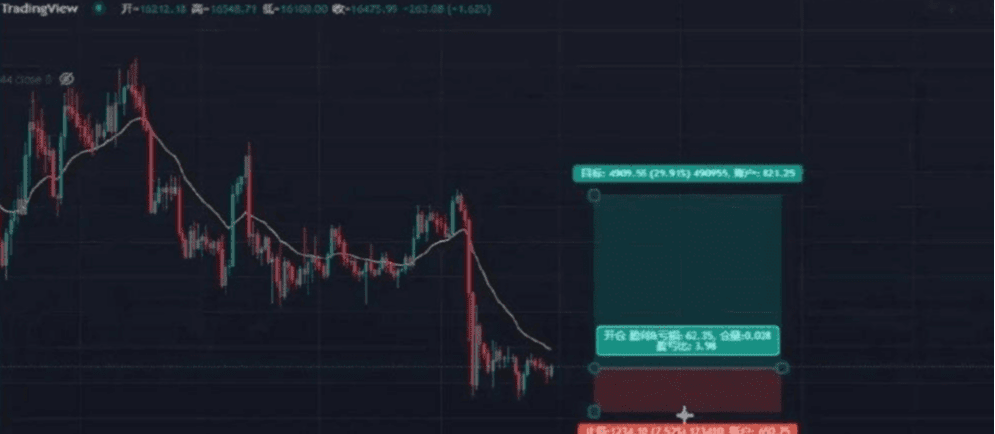
Many people know nothing about position management other than the profit-loss ratio. For example, going long at the position in Figure 3 has a profit-loss ratio of 2.41, but aside from using the tools from TradingView to get the profit-loss ratio, there is no other way to proceed.
Some people fully load their positions every time they trade, betting as much as they have in their accounts. They can't clearly identify how much position they should take each time and don't know how many times to leverage. They may even not understand what defining a position by loss means.
To make it easier to use, I created a calculator myself, as shown in Figure 4.
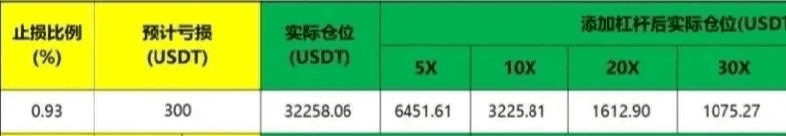
We will explain how to obtain and use this calculator later.
In fact, what we trade on is volatility. If we are trading low-leverage contracts on a daily chart and do not manage the positions well, it can lead to significant losses.
The positions taken on the daily chart and the hourly chart are different. Let's compare. Assume you are only willing to lose a maximum of 1,000 USD each time.
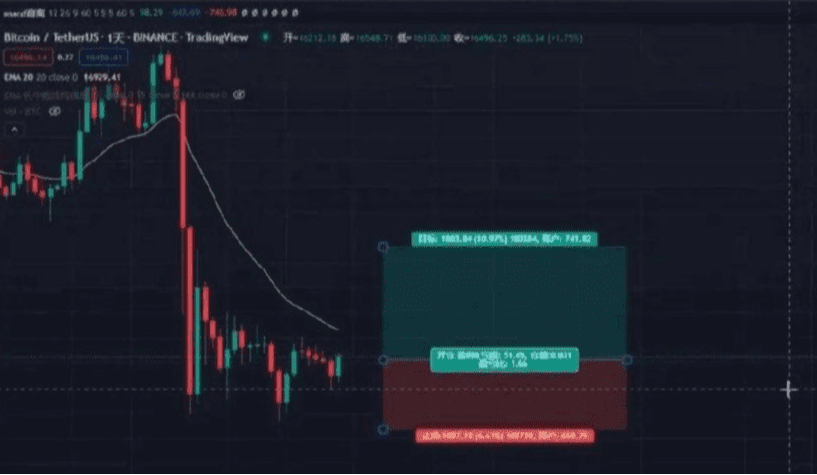
Daily chart:
As shown in Figure 5, the percentage of stop loss on the daily chart is 7.52%, and the take profit is nearly 30%.
Hourly chart: In the hourly chart of Figure 6, the profit-loss ratio is set at 1:2.
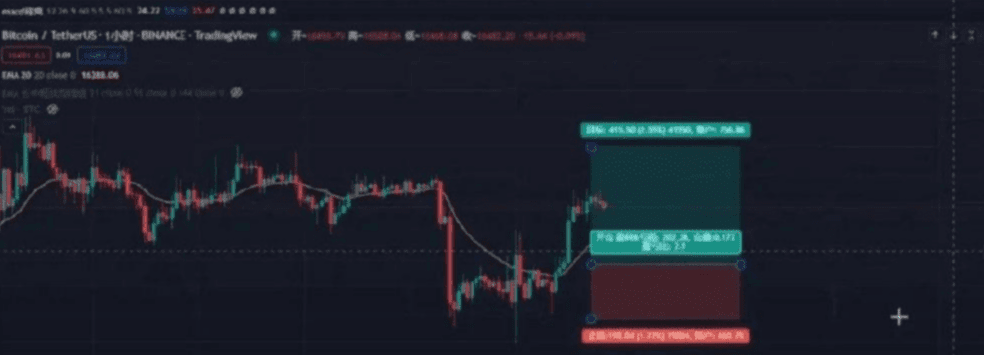
At this time, the stop loss ratio is 1.22%, and as long as the take profit rises to 2.55%, this trade will be closed with a profit.
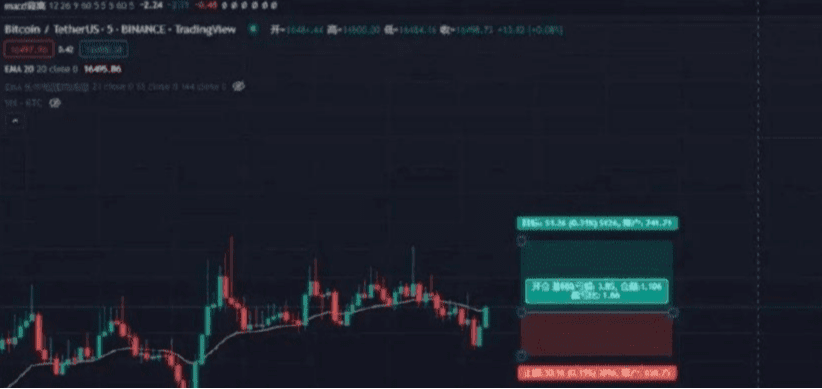
5-minute chart:
Under the same conditions, my profit-loss ratio on the 5-minute chart will look like Figure 7.
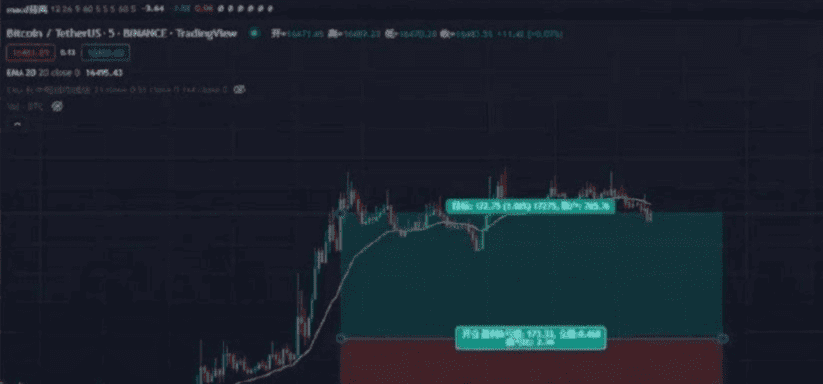
The stop loss is only 0.45%, and the take profit is 1.06%.
So comparing these three cycles, do you still think that you can open the same position in different cycles? Of course not. Because we are capturing volatility. The profit-loss ratios are the same for each cycle, but the size of the volatility is different. Therefore, under the condition of expecting the same losses and gains, our position should be inversely proportional to volatility.
3. Usage and explanation of the calculator
To make it easier to use, I created a calculator to calculate position sizes. Everyone can use this calculator in Figure 8 when entering the market.
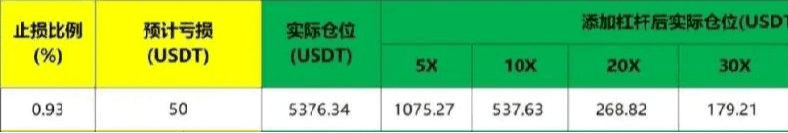
All trading should first consider how much you are prepared to lose. The 'expected loss' in the calculator is the risk control ratio, and the position risk adopts a fixed percentage model.
In the calculator, you only need to fill in the numbers corresponding to the yellow boxes; the other numbers will be automatically calculated based on the input numbers. Do not manually change any numbers other than those corresponding to the yellow boxes.
For example, if I have 1,000 USD in my account and am only willing to lose 5% each time, then I would have to lose 20 times in a row to exhaust my funds. So, multiply the risk ratio by the current account balance (5% * 1,000), and the result is the number to fill in for 'expected loss' (50).
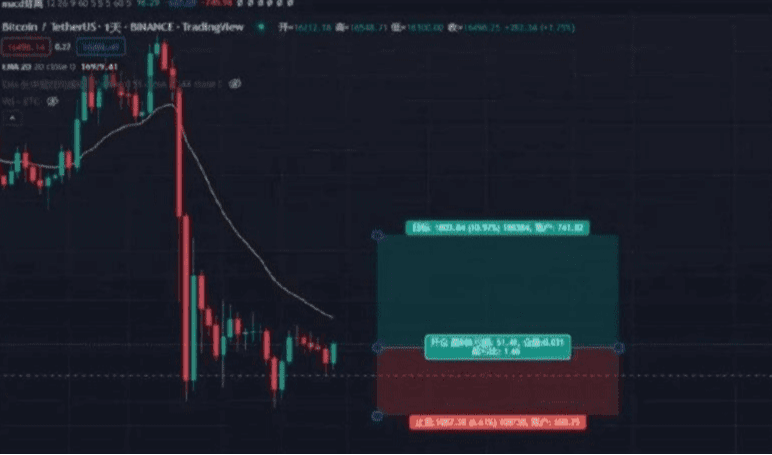
Let's take the 5-minute chart from Figure 9 as an example. Now we want to enter a long position at market price.
The stop loss ratio is 0.19, the take profit is 0.31, and the profit-loss ratio is 1.66.
Fill in the stop loss ratio as 0.19 and the expected loss as 50, which will allow you to calculate that the actual position size needed is 26,315 USD, which is the number corresponding to 'actual position'. If you're trading contracts, you'll need to use leverage, which depends on the subsequent data; the number of times you increase the leverage will correspond to the numbers shown. However, my suggestion is still to use small multiples of leverage.
So how much can we earn? If the opening price and take profit price (latest price) are corresponding, then fill in the opening price as 16,494 and the latest price as 16,546.
In other words, when the market rises to 51.26 (Figure 9), the expected profit for this trade is 82.96 USD. The opposite is true for short selling. After deducting the subsequent fees, this is the final actual profit.
Daily chart:
Fill in the stop loss ratio as 6.61, the opening price as 16,444, and the latest price (take profit price) as 18,254. The result is shown in Figure 13.
Regardless of which cycle we are trading, as long as we manage the positions well, we can ensure that profits and losses are the same. Especially as a beginner, do not complicate the position size; using this calculator is sufficient.
Of course, this calculator was made for my own convenience without considering the issue of adding positions. Our old version of the calculator can calculate additional positions.
The old blogger only does real trading, and the team still has spots available for you to join.

