
$BMT /USDT – Short Trade Signal (1h Timeframe)
Current Price: 0.0695
Support Level: 0.0680
Resistance Level: 0.0730
Entry Zone: 0.0698 – 0.0715
Trade Targets
TP1: 0.0670
TP2: 0.0650
TP3: 0.0620 (final target)
Stop Loss: Above 0.0735
BMT is under heavy selling pressure after failing to hold above 0.0750. The chart shows a clear breakdown with strong red candles. If price closes below 0.0680, more downside is likely. Short trades from pullbacks to resistance offer better risk-to-reward, with targets set at lower support levels.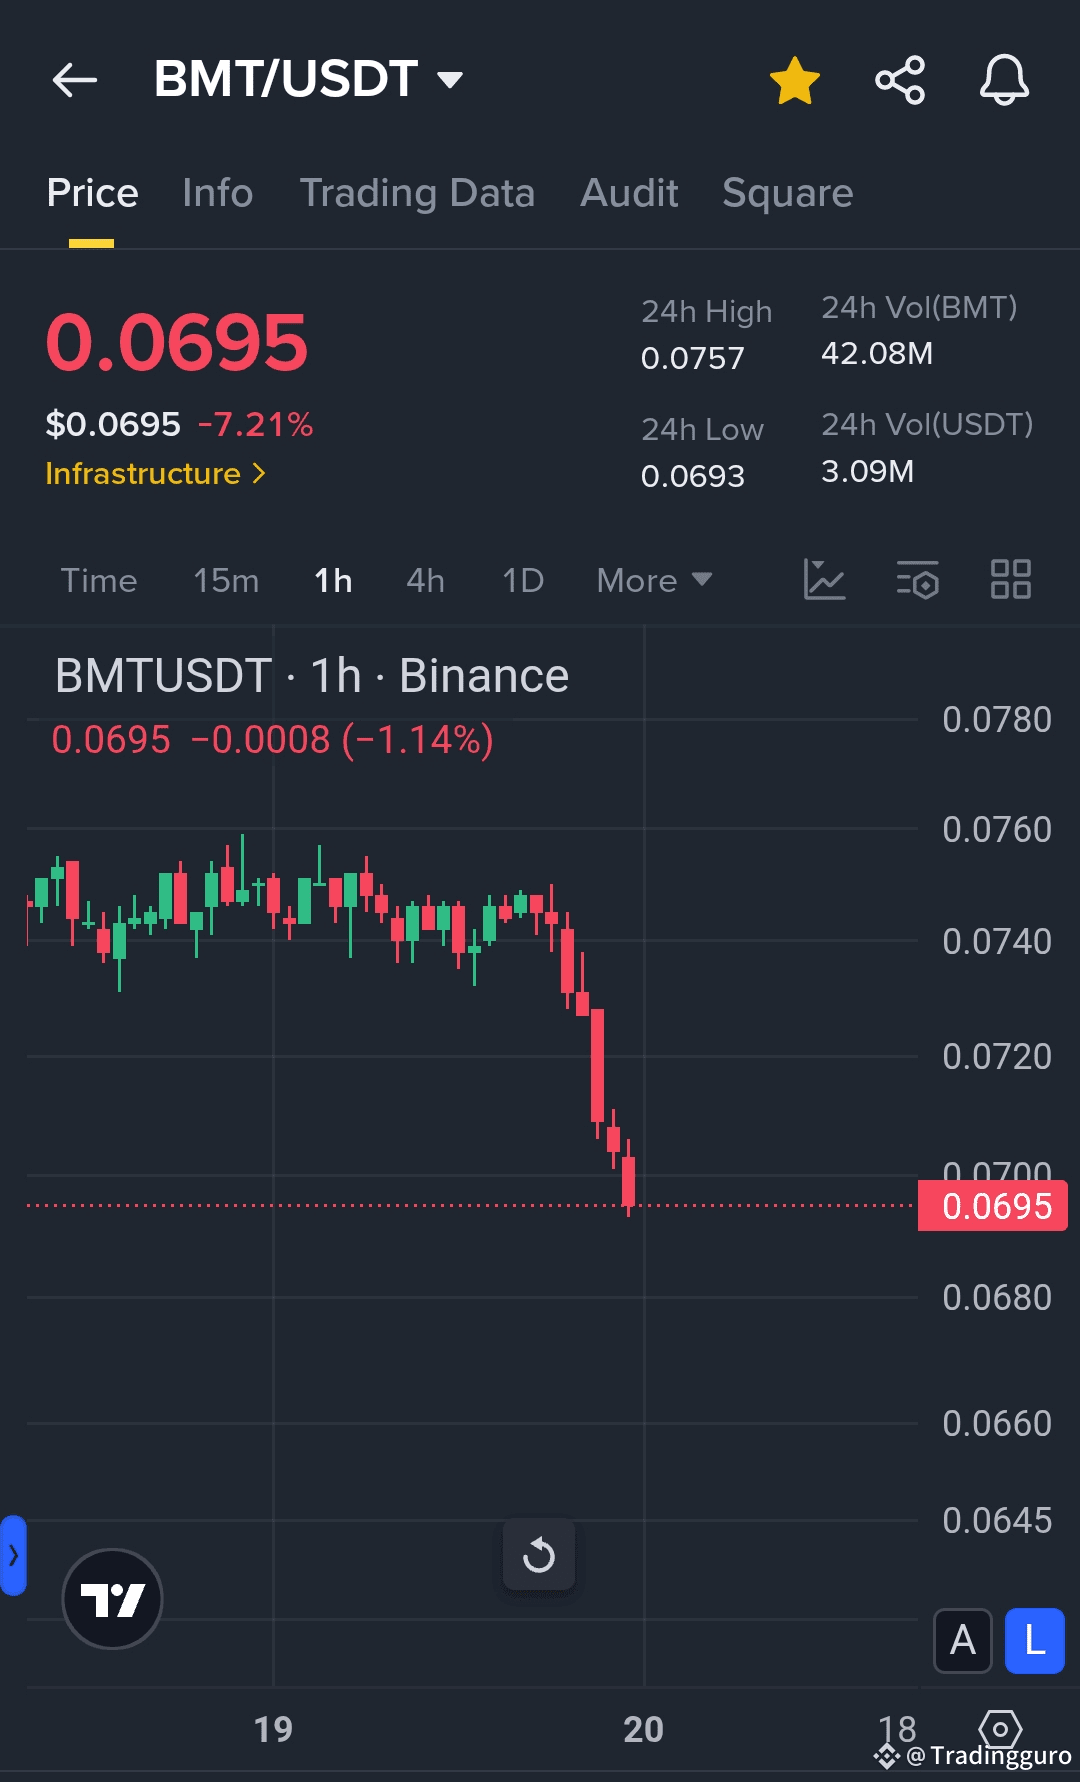
In the fast-moving world of crypto, one of the biggest challenges is understanding what’s really happening behind token movements. Numbers and transaction logs provide precision, but they are often overwhelming, scattered, and time-consuming to analyze. Bubblemaps addresses this problem by turning raw blockchain data into a clear, visual experience. It is an analytics platform that maps token distribution and wallet relationships into colorful bubbles, where each bubble represents a wallet, the size shows balance, and connections highlight fund transfers. By introducing this visual shift from spreadsheets to patterns, Bubblemaps makes hidden risks like concentrated holdings, coordinated selling, or custodial wallets obvious at a glance.
The simple but powerful idea behind Bubblemaps is that visuals are much faster to interpret than raw numbers. A cluster of three giant bubbles tied to the same node suggests a custody wallet or a mixer. Hundreds of small evenly sized bubbles suggest healthy retail distribution. A single oversized bubble indicates a major concentration risk. While these visual signals aren’t final proof, they act as strong leads that allow traders, researchers, and compliance teams to focus their attention where it matters instead of manually sifting through thousands of transactions.
Bubblemaps comes equipped with features that turn curiosity into real decision-making. Time Travel allows users to rewind token distribution to any previous date and verify claims like “founders never sold.” Clustering and “Magic Nodes” group addresses that are likely controlled by the same entity, such as custodial exchanges or liquidity pools, reducing noise and exposing actual ownership patterns. P&L analytics for clusters reveal whether large holders are sitting on profits (and thus likely to sell) or are underwater. The drill-down function lets users trace wallet flows across hops and even across blockchains, while multi-chain support ensures that cross-network transfers are captured. For exchanges, journalists, or investors, these tools enable investigations that move quickly from suspicious patterns to confirmed insights.
Real-world workflows already show Bubblemaps’ utility. Exchanges use it in pre-listing checks to assess holder concentration. Investigators turn to it for rug-pull analysis, spotting coordinated dumps during sudden token spikes. Venture capital firms and DAOs use the maps for due diligence, validating whether token allocations and tokenomics are as advertised. Journalists visualize money flows to make crypto stories clear to audiences, while compliance and security teams scan for suspicious wallets or hidden custodial hubs. Bubblemaps is not a toy—it’s a practical tool shaping how decisions are made across crypto.
Of course, Bubblemaps makes some things easier and leaves others to deeper investigation. It is excellent at spotting risks like concentration, visualizing wallet movements, and explaining patterns to both technical and non-technical stakeholders. However, it isn’t a silver bullet. A large bubble could be an exchange cold wallet or a treasury multisig, not necessarily a malicious whale. Clustering heuristics can make errors, and sometimes invisible cross-chain bridges leave part of the story off-map. Investigators must always corroborate Bubblemaps’ visuals with transaction-level traces and off-chain context like team statements or whitepapers.
The Bubblemaps ecosystem itself extends beyond the charts. Through features like the Intel Desk, community flagging, and governance with the $BMT token, it crowdsources investigations and prioritizes suspicious tokens. This model allows investigations to scale, with the community spotting anomalies and funding deeper analysis. Still, quality control is essential for crowdsourced intelligence, making governance a key piece of Bubblemaps’ future.
Practical usage tips bring out the best of the platform. Users are encouraged to start by scanning top holders to identify outsized bubbles, then use Time Travel to check how holdings evolved. Clicking into Magic Nodes followed by verification on Etherscan or exchange databases reduces false assumptions. Observing P&L clusters helps anticipate selling pressure, while combining Bubblemaps with watchlists and alert systems creates a proactive monitoring strategy.
Ultimately, Bubblemaps is for anyone in crypto who cares about clarity and risk—traders, investors, exchanges, compliance officers, or even journalists. It won’t make you infallible, but it will make you faster and more accurate by surfacing red flags before they become losses. In a market where opacity often hides manipulation, Bubblemaps’ ability to make supply and flow readable is a powerful advantage. It transforms blockchain data from noise into intelligence, giving users confidence in a space where surprises are costly.
♡𝐥𝐢𝐤𝐞💬 ➤ @Bubblemaps.io | #Bubblemaps | $BMT
