Dogecoin's price has retraced by 2% in the past 24 hours, erasing weekly gains and pushing the 7-day performance into negative territory. Some on-chain indicators suggest that the downside potential for Dogecoin may not yet be over.
Specifically, the breakdown of two key groups and profit supply data suggests potential bearish continuation. If key support levels break, Doge may decline, possibly leading to a 15% drop from current levels.
Two important cohorts are exiting.
The HODL Waves indicator shows that two key Dogecoin holding groups are now reducing their positions. These cohorts are:
The share of holders for 6 months to 12 months has decreased from 15.46% to 14.705% in the past two weeks.
Holders from 1 month to 3 months have significantly decreased from 8.0% to only 4.614%.
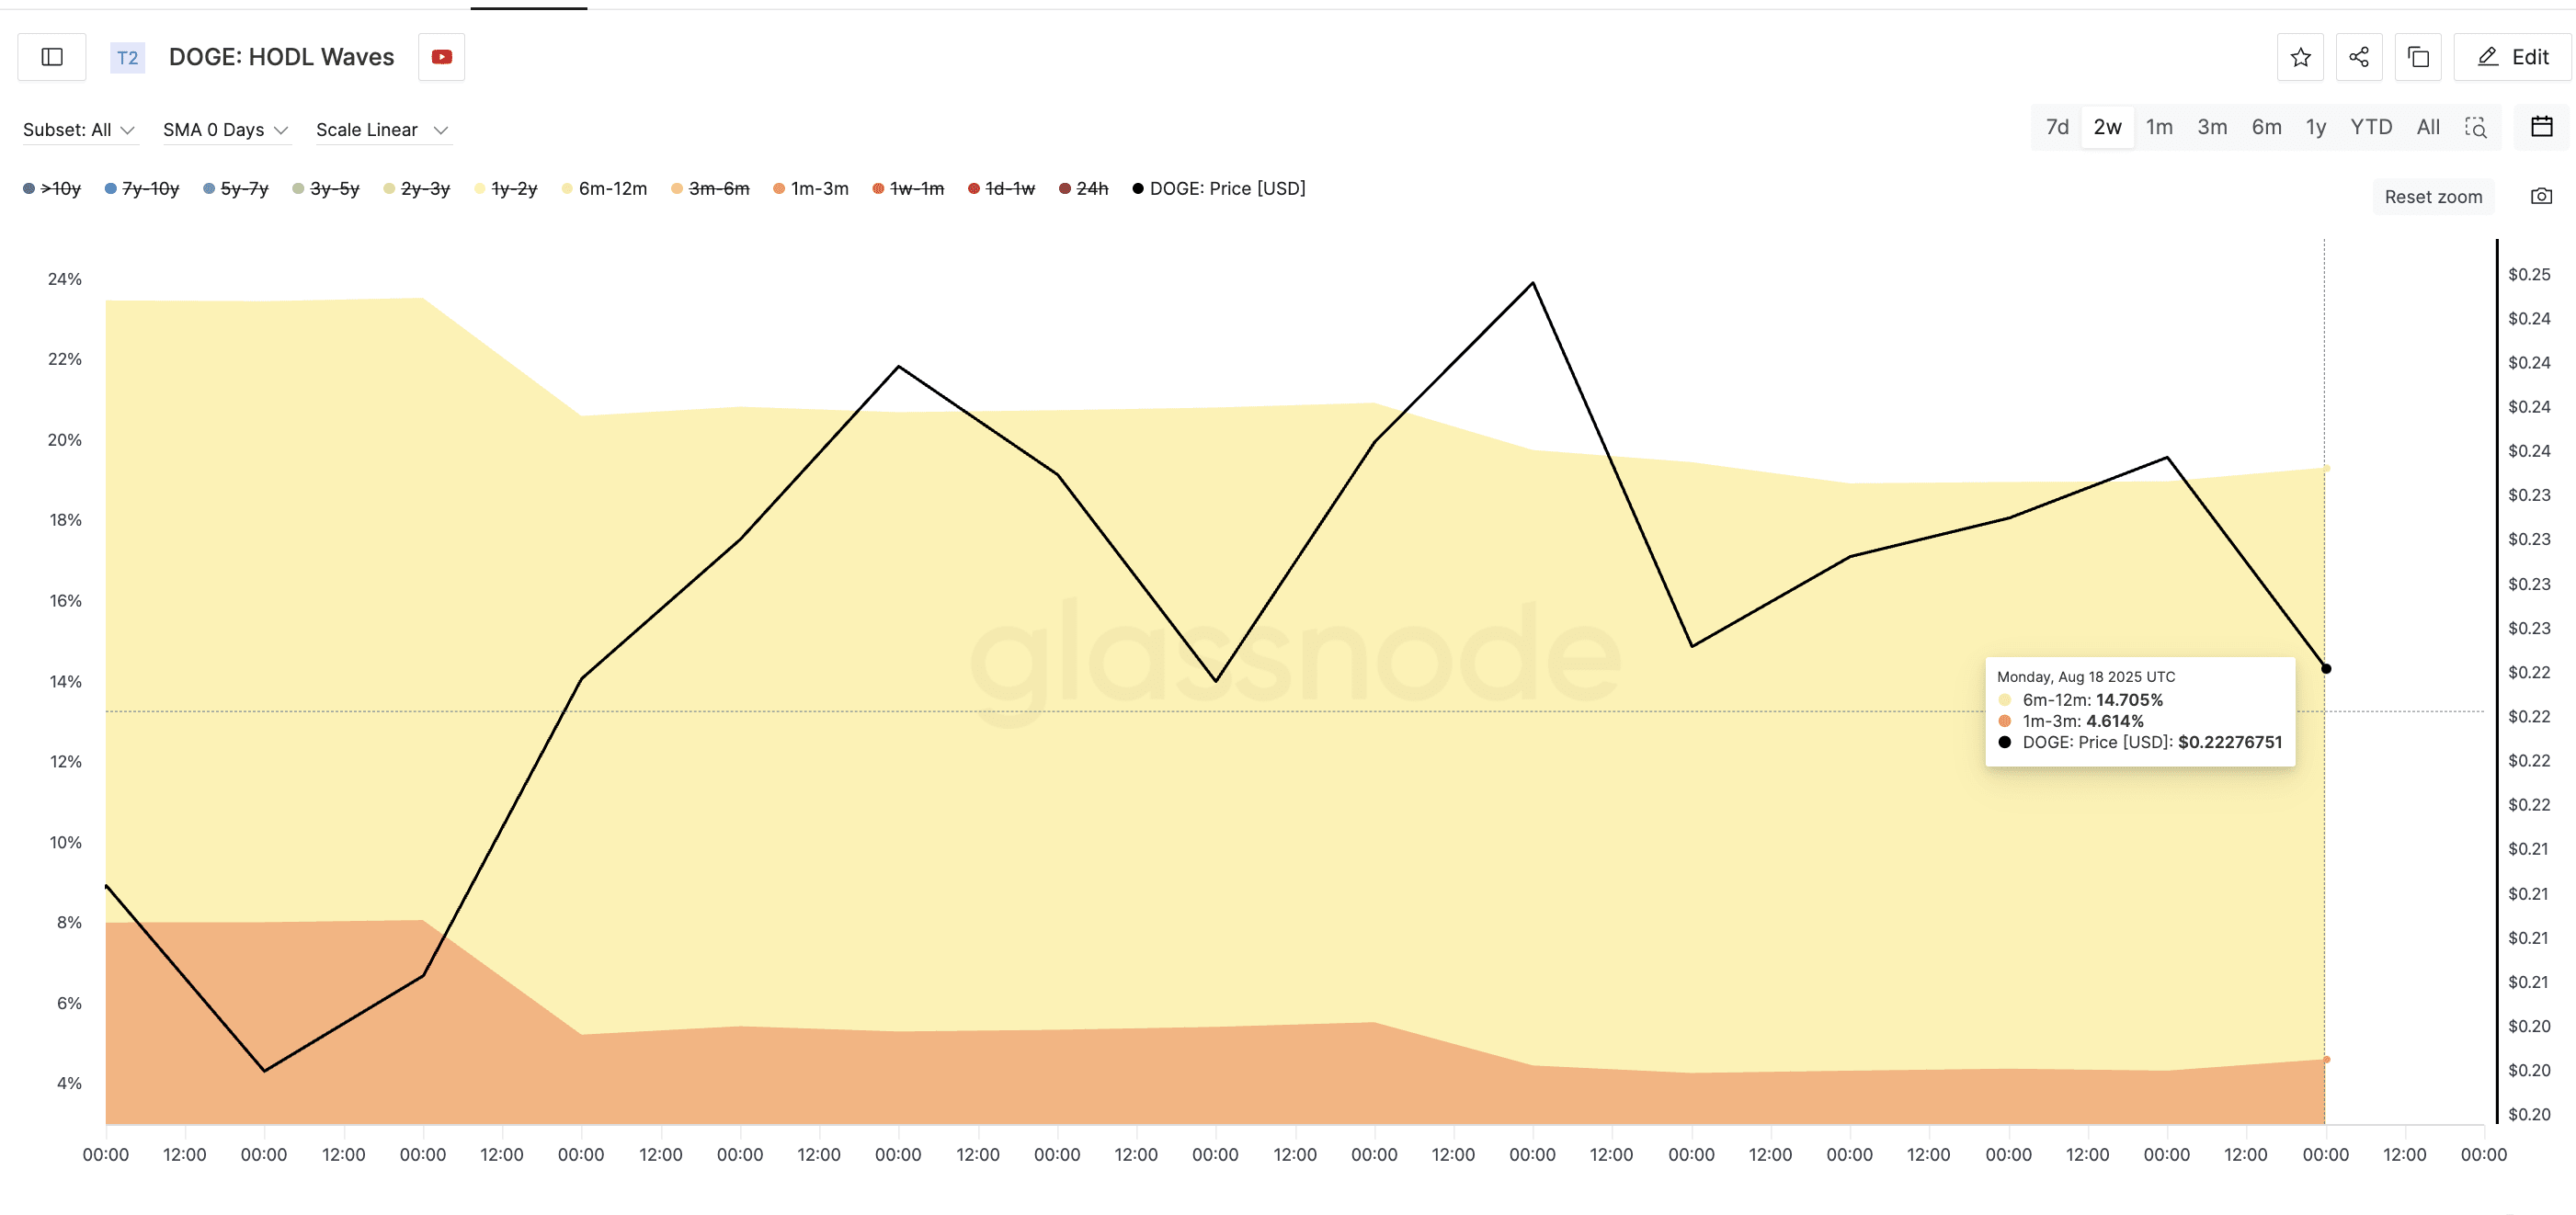
Dogecoin Price and HODL Waves: Glassnode
This indicates that mid- to long-term believers are selling, not just short-term traders. These groups typically signify a change in sentiment among the broader holder base. When both reduce their exposure simultaneously, it usually means a decrease in confidence for a recent price recovery.
This is particularly concerning, as this shift occurs during a downturn rather than after a rebound. This means these holders are not taking profits; they are exiting with losses or minimal returns, which could signal deeper bearish concerns.
HODL Waves by age show the distribution of tokens, helping to determine how long different holder groups keep their tokens before moving them.
Profit supply remains high, which is a concern.
Currently, 76.95% of Dogecoin's circulating supply is still in profit. Historically, whenever this number exceeds 73%, prices tend to correct.
The last time at the same level, on July 30, Dogecoin traded at approximately $0.22. Shortly after, the price fell from there to $0.19.
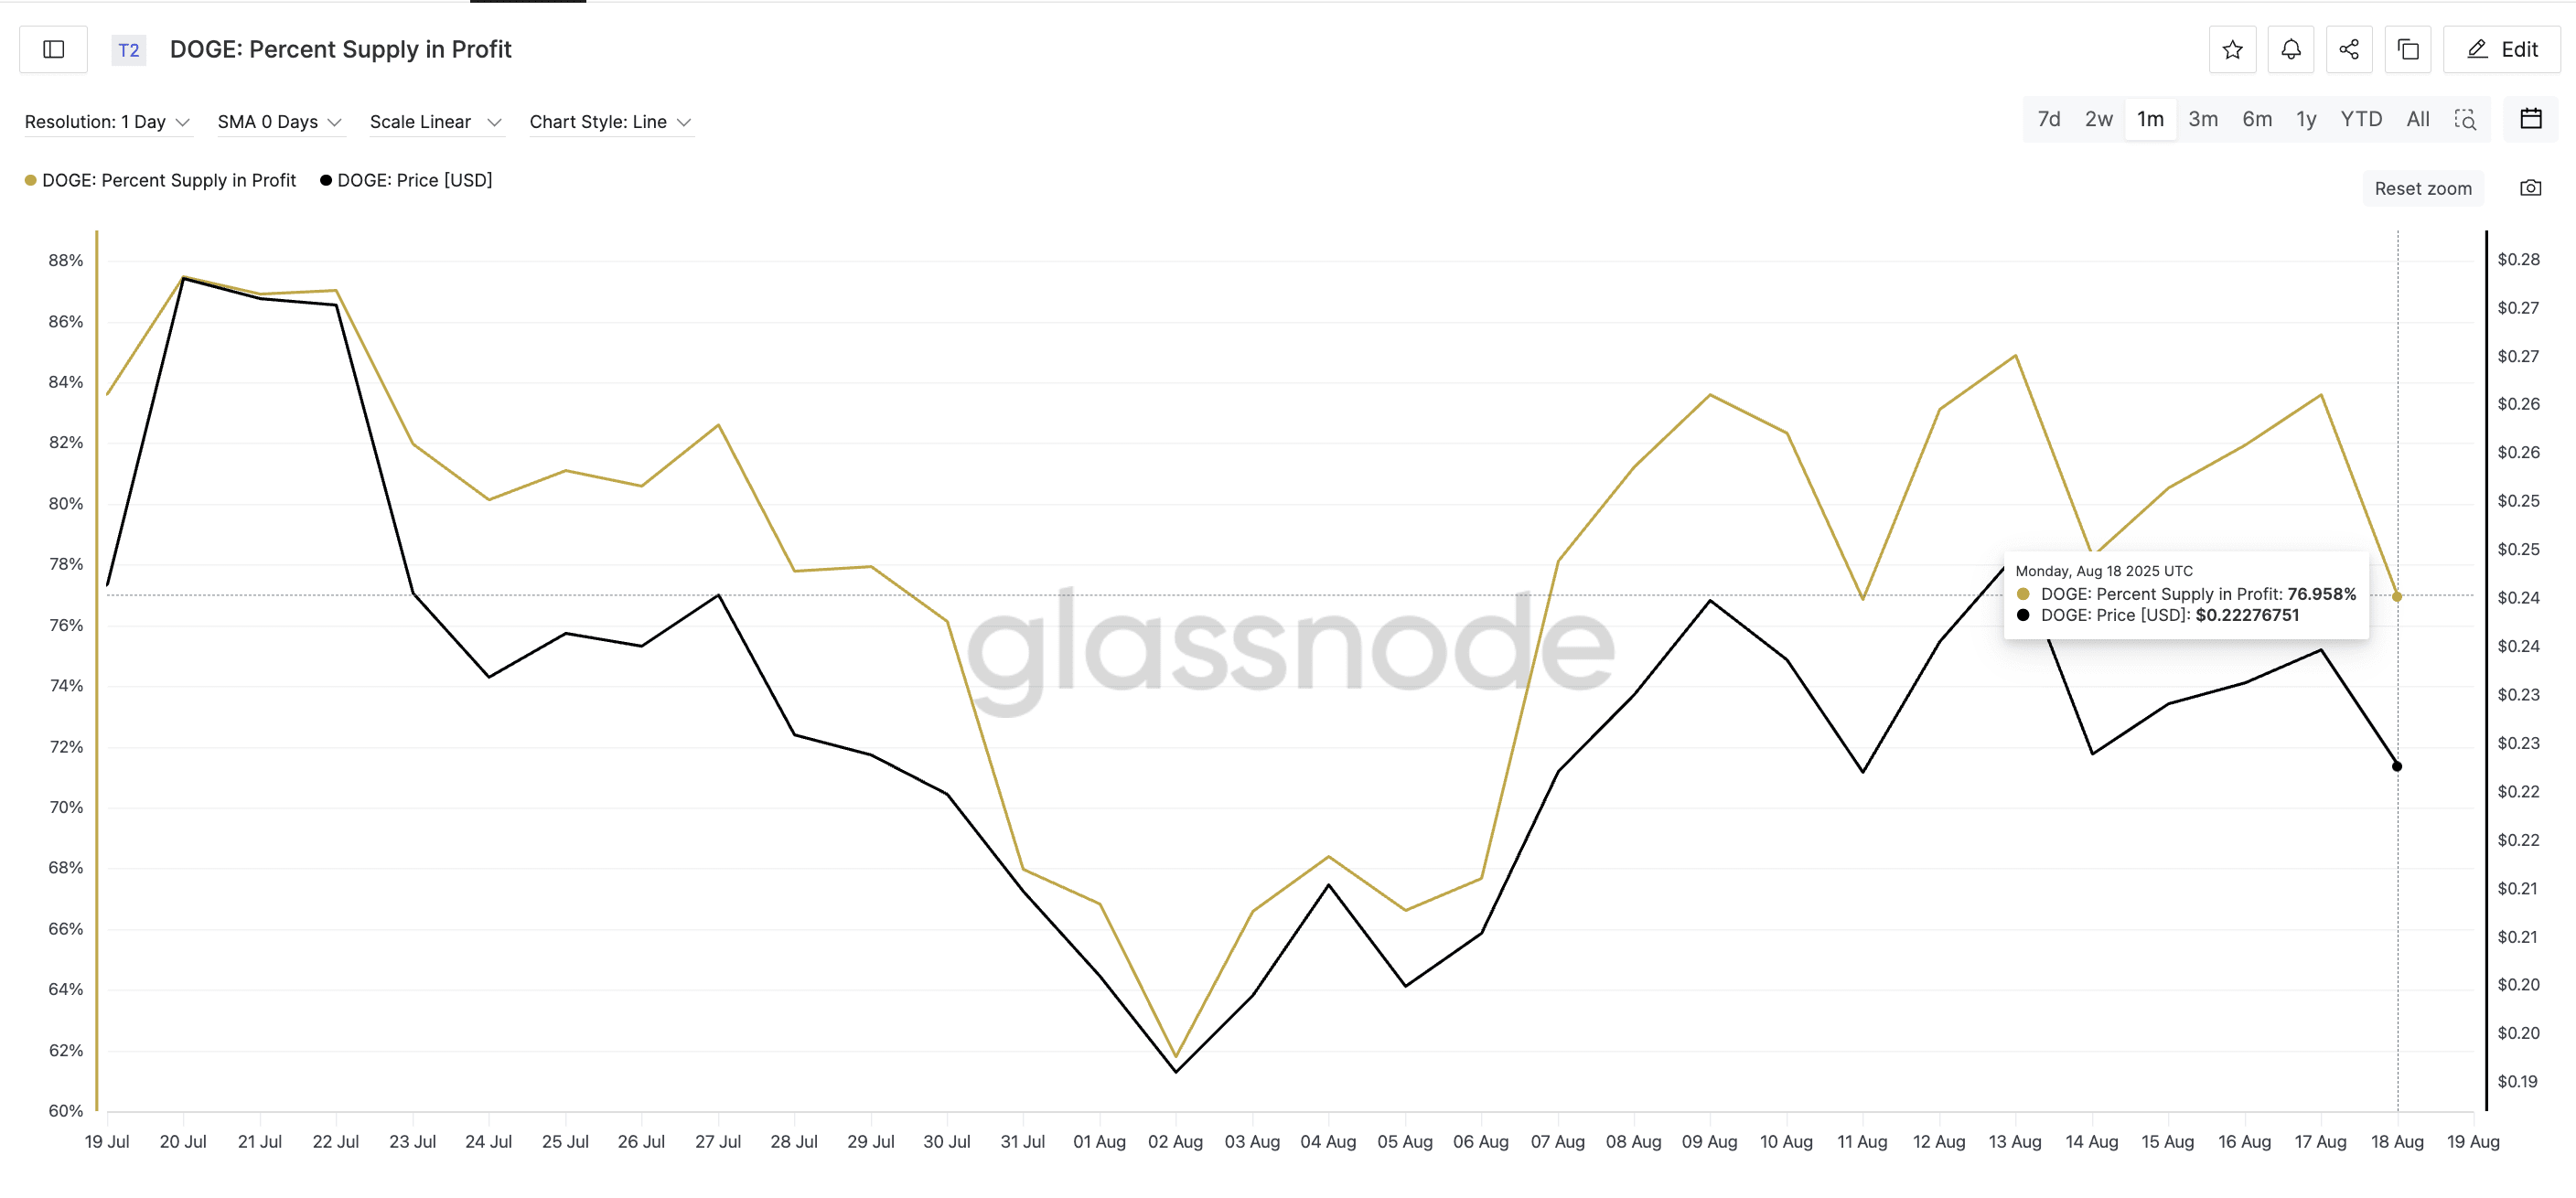
Dogecoin Price and Profit Supply Percentage: Glassnode
At that time, the proportion of supply in profit dropped to 61.79%, and it wasn't until after the reset that Dogecoin's price began to climb again. Currently, we are in the same 76% range, with the risk that the same setup may replay: profit supply needs to decrease before buyers return. Until then, every rally faces heavy selling pressure.
This is also related to HODL Waves. When profit supply is high and mid- to long-term holders start to reduce their positions, it usually reflects a fear of losing profits or of a premature decline.
For token TA and market updates: Want more insights like this on tokens? Sign up for editor Harsh Notariya's daily crypto newsletter here.
Dogecoin price charts and key indicators confirm bearish pressure.
Technically, Dogecoin is hovering near the key support level of $0.21. If it falls below this level, the structure will be entirely bearish. The next key support level is $0.20, but a broader bearish target is at $0.18, which would mark a 15% decline from the current price.
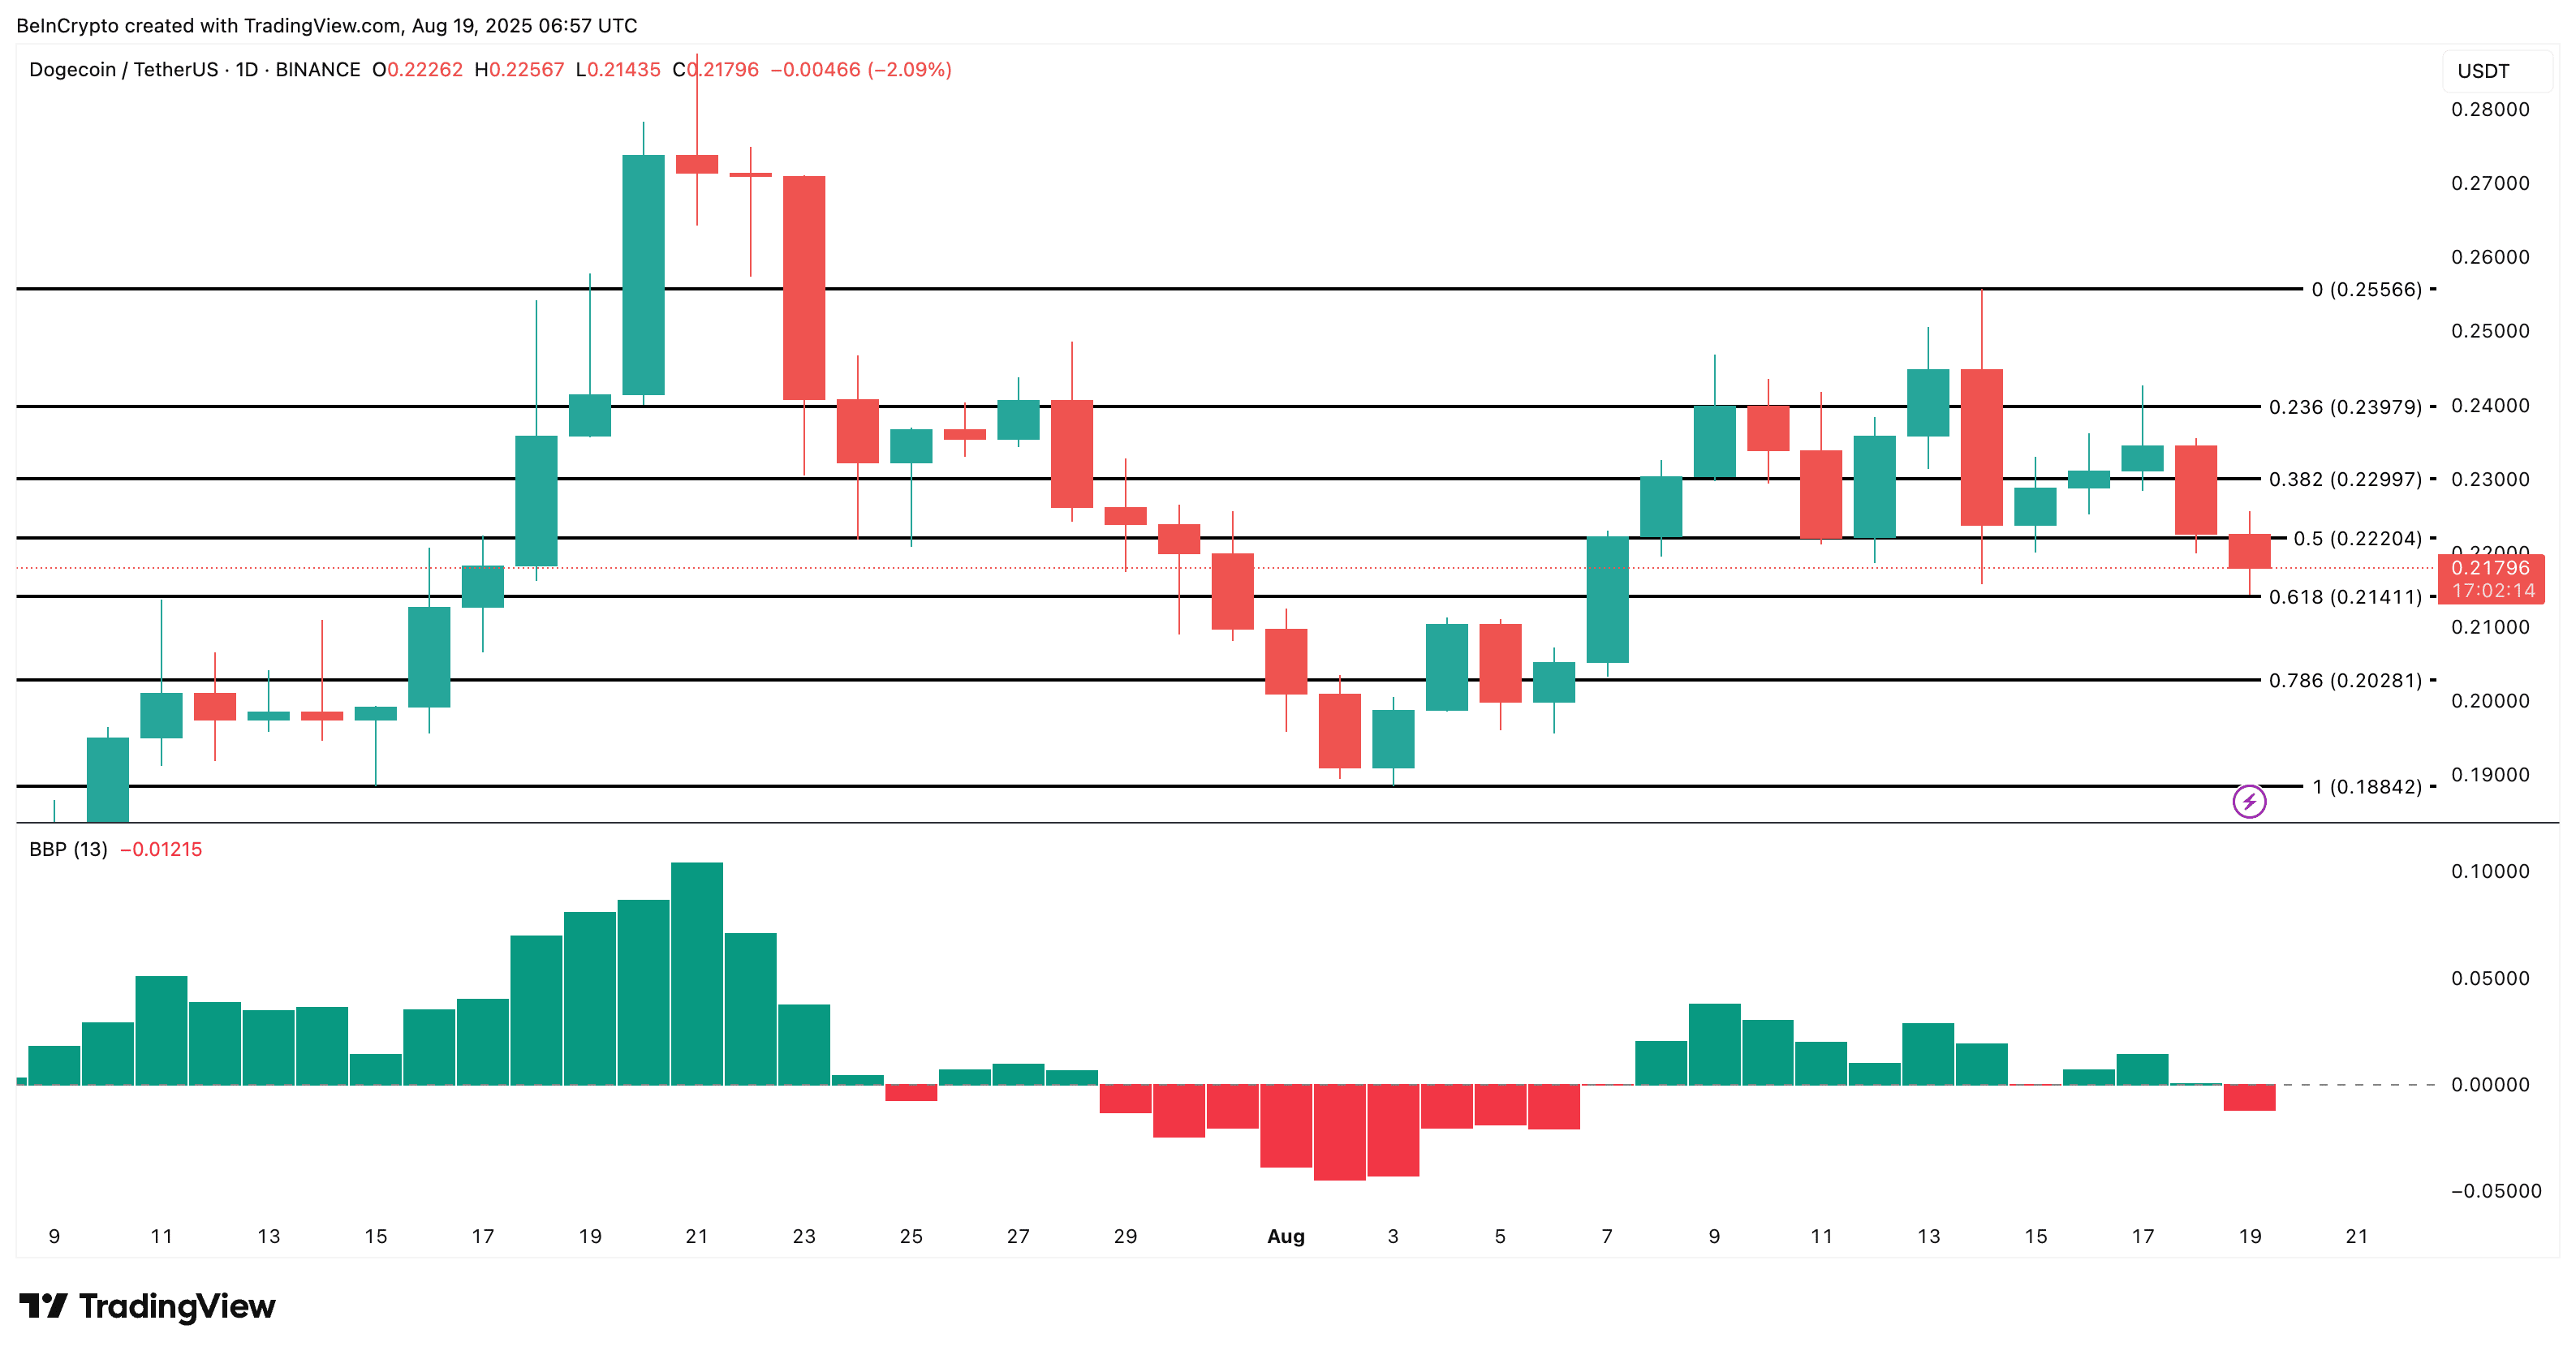
Dogecoin Price Analysis: TradingView
Meanwhile, the Bull-Bear Power (BBP) indicator has turned negative. This means that selling pressure has surpassed buying pressure, reinforcing what on-chain data has already shown. Retail is selling, and buyers are staying away.
Bull-Bear Power (BBP) Indicator (also known as Elder Ray Index) measures the strength of buyers (bulls) and sellers (bears) by calculating the difference between price extremes and moving averages. It helps determine whether bullish or bearish strength currently dominates the market.
The momentum shift is evident. If the level of $0.21 fails to hold, the likelihood of a bearish scenario increases. However, if Dogecoin's price successfully rebounds and breaks through $0.23, the bearish hypothesis will be invalidated.
