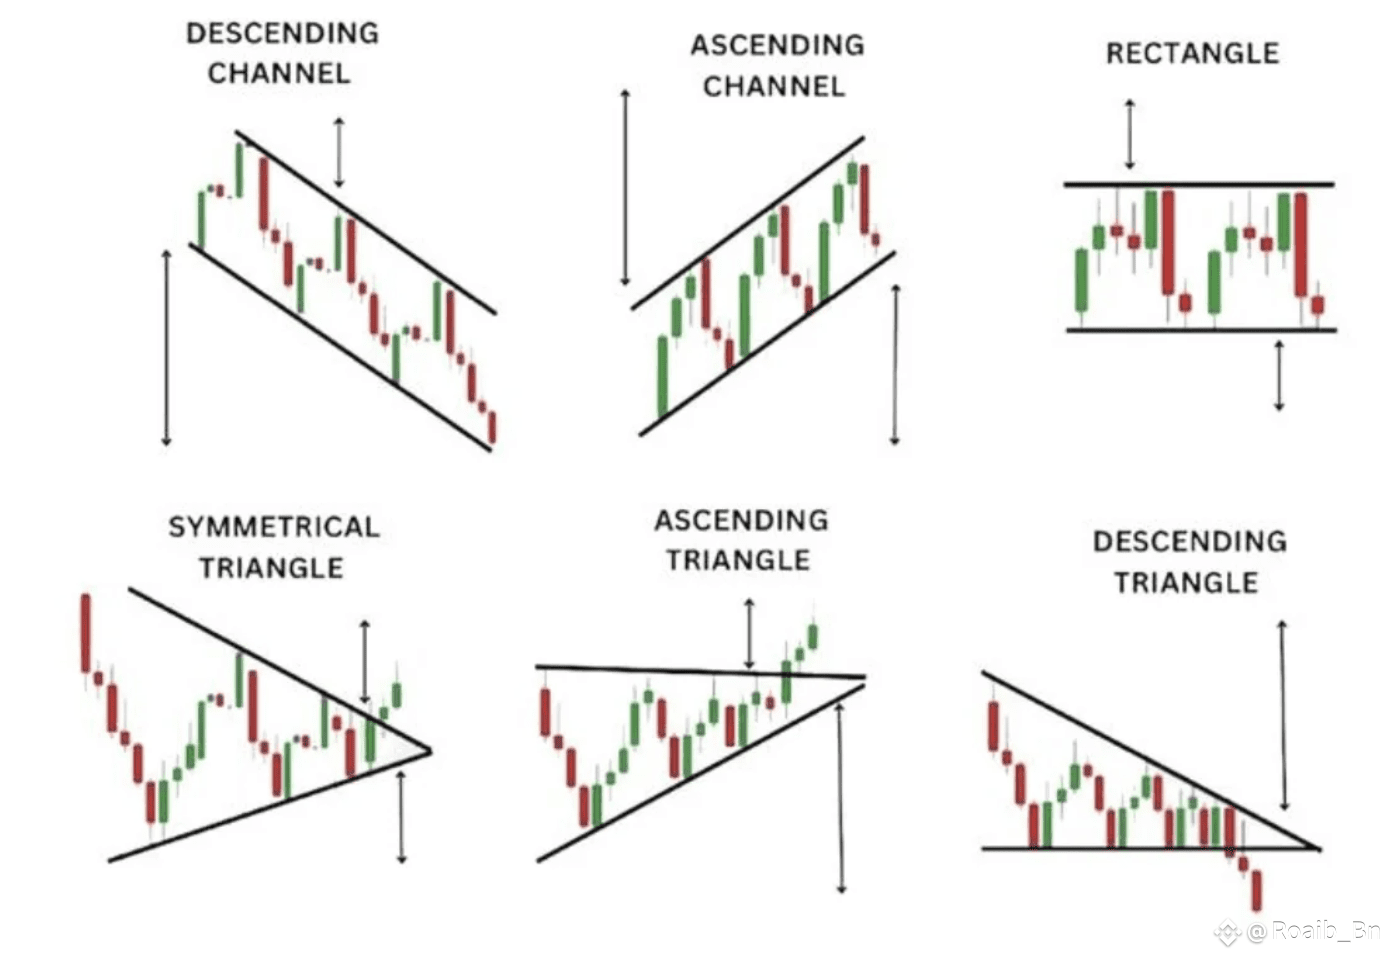
1️⃣ Descending Channel
Price moves down inside two parallel lines.
Shows a bearish trend, but breakout can happen on either side.
---
2️⃣ Ascending Channel
Price moves up inside two parallel lines.
Shows a bullish trend, but breakout can also occur downward.
---
3️⃣ Rectangle
Price moves sideways between support and resistance.
Shows consolidation before a breakout in either direction.
---
4️⃣ Symmetrical Triangle
Price forms lower highs and higher lows, converging into a point.
Usually signals a breakout — can be bullish or bearish.
---
5️⃣ Ascending Triangle
Flat resistance on top, higher lows from below.
Strong bullish signal when price breaks above resistance.
---
6️⃣ Descending Triangle
Flat support below, lower highs from above.
Strong bearish signal when price breaks below support.
HERE is the candles image 👇
IF you find the post helpful then please follow like and comment on it thanks 👍
#BinanceHODLerPLUME #ETHInstitutionalFlows #PowellWatch #MarketPullback #StrategyBTCPurchase


