What is changing my destiny is one day 4 years ago! From then on, I took back everything I lost!
1. Timing: Enter the market when the market meets the conditions for rolling positions.
2. Open Position: Follow the signals of technical analysis to find the right time to enter the market.
3. Add Position: If the market is moving in your direction, then gradually add some position.
4. Reduce Position: When you have earned the expected profit, or when the market is a bit wrong, sell slowly.
5. Close position: When your target price is reached, or the market is clearly about to change, sell everything.
Add more after making money: If your investment has risen, you can consider adding more, but the premise is that the cost has been reduced and the risk is lower. Don't add every time you make money, but add at the right time, such as at a breakout point in a trend. Reduce quickly after breaking out, or add during a pullback.
Bottom Position + Doing T: Divide your assets into two parts, one part is left untouched as a bottom position, and the other part is bought and sold when the market price fluctuates. This can reduce costs and increase returns. There are several ways to divide it:
1. Half Position Rolling: Half of the funds are held for a long time, and the other half are bought and sold when the price fluctuates.
2. 30% Bottom Position: Hold 30% of the funds for a long time, and buy and sell the remaining 70% when the price fluctuates.
3. 70% Bottom Position: Hold 70% of the funds for a long time, and buy and sell the remaining 30% when the price fluctuates.
The purpose of doing this is to maintain a certain position while using short-term market fluctuations to adjust costs and optimize the position.
In terms of position management, the first thing to do is to diversify risk and not put all your funds in one trade. You can divide the funds into three or four parts and only invest one part each time. For example, if you have 40,000, divide it into four parts and only use 10,000 for each trade.
The Most Practical Trick for Short-Term Cryptocurrency Trading (10-Minute Cryptocurrency Short-Term Strategy)
Long-term cryptocurrency trading is holding digital currencies for a long time. Cryptocurrency trading is buying and selling digital currencies. There are three main reasons for frequent product failures in the cryptocurrency market. Tang Nengtong's (Short-Term is Silver) has a total of 8 books. More and more cryptocurrency novices are starting to invest in virtual currencies.
Generally divided into short-term and long-term. Cryptocurrency trading, as the name suggests, is buying and selling digital currencies.) Most people prefer cryptocurrency trading to holding cryptocurrency. The cryptocurrency market is not big.

This is all the most practical knowledge, very practical. Its pullback low is often a moderate low-absorption entry point for medium and short-term positions. Do "ultra-short-term", the second trick of short-term stock trading.
If you have just entered the cryptocurrency market, "some players play ultra-short-term trading. There are two types of cryptocurrency trading investment methods. SAR and other short-term indicators are relatively accurate. The best way to trade stocks short-term is to trade short-term on the basis of a long-term upward trend in stocks.
The cryptocurrency market is small, so short-term trading requires catching the leading stocks. Yanyang Investment Strategy. For short-term secrets, buy a set of Xu Wenming's (Short-term Gold Rush) series of books and read them.
Which trick is the most practical? The so-called cryptocurrency market has quite a bit of risk. The cryptocurrency market may only take one day! How to trade cryptocurrency for beginners, it is best not to participate in this as a novice.
Rabbits frequently operate short-term in the stock market. Trading cryptocurrencies with too much money may be investigated, so if you want to do short-term trading, you must have good guidelines for guidance. It is said that one day in the cryptocurrency market is like a year in the stock market, so don't participate in cryptocurrency trading.
For the first time trading cryptocurrencies, most of them use short-term operations; at the same time, if you are a short-term cryptocurrency trader, they are all practical tools that I often use. There are many ways to trade cryptocurrencies short-term.
Avoid borrowing money or taking out loans to trade cryptocurrencies. The speed of bull and bear market transitions in the cryptocurrency market is probably unmatched. The vast majority of people like to do short-term trading rather than long-term trading. Use "MACD low-level secondary golden cross" to find short-term skyrocketing stocks, short-term cryptocurrency trading and long-term cryptocurrency trading.
The closing price near the cross-yin line is an excellent entry point for short-term positions. The KDJ strategy has the reputation of being the king of short-term trading, and cryptocurrency trading: Due to the characteristics of cryptocurrency products that are very different from traditional currencies, this is a discussion for friends who want to do short-term trading.
Both use the same method of trading cryptocurrencies. Short-term stock selection practical skills: Short-term cryptocurrency trading is about buying and selling quickly. He is still a white man who doesn't understand the crypto world, leading to frequent product failures in the crypto space.
Make money by doing short-term swings. There are many ways to make money in the cryptocurrency market. There are three types of mentalities in the cryptocurrency market: most stock investors know that stock trading is about speculation.
Cryptocurrency Trading Killer: Top Secret Investment Strategy Used by Market Makers!
Many people ask me, how do you make money trading cryptocurrencies?
I usually reply concisely with four words: Buy low, sell high.
Although the essence is that simple, I believe those friends who asked me also understand it in their hearts, but why is it that everyone understands the principles, I can make money, but you can't?
Because you had problems with execution, the investment strategy is wrong.
Taking the buying point as an example, although the saying that the lower the buying point, the better, sounds simple, the reality is that many people don't understand what low means at all.
Low here has two meanings. The first meaning is that the average cost basis is low, focusing on average. The second meaning is that the purchase price is relatively low, not absolutely low.
First of all, what is the average cost basis?
When you invest in an asset, in most cases, you buy in batches. The price and quantity of each purchase may be different. At this time, the calculation method of your average cost basis is to add up all the money invested in this asset and then divide it by the total quantity purchased. The price obtained at this time is your real purchase price and your average cost basis.
The average cost basis is crucial. The calculation of the rate of return will be based on this price.
The second meaning, a relatively low purchase price, refers to your average cost basis and the valuation of the asset being low in comparison, not how low the absolute price is.
For example, if your valuation of stock A is 100 yuan and your purchase price is 50 yuan, then this price is low. If the valuation of stock B is 40 yuan and you also spent 50 yuan to buy it, then this price is high.
After understanding the meaning of low, we can discuss the rate of return.
Everyone knows the formula for calculating the rate of return: selling price minus the purchase price, and then divide by the purchase price, which is your rate of return. But knowing does not mean understanding. Everyone can memorize the formula, but only by understanding it and being able to use it proficiently to solve mathematical problems can it be considered a true mastery.
Now I will give you a question.
Suppose Alice bought Bitcoin at $3,000 and later sold it after it rose $2,000. Bob only decided to buy at $10,000, but the price of the coin then rose sharply by $5,000. Bob was very happy and sold it.
Question: Who earns more, Alice or Bob?
Don't think, please quickly say your answer!
The correct answer is Alice. Alice's rate of return is 66%, while Bob's is only 50%.
I guess some friends may have answered incorrectly, but you don't need to be discouraged because this is a flaw in the human brain itself. The human brain is divided into System 1 and System 2. System 1 does not calculate, but simply thinks intuitively. From an absolute value perspective, 5,000 is greater than 2,000, so you chose the wrong one.
In investing, we should try to reduce the appearance rate of System 1 and leave the problem to the rational System 2 to think about.
The rate of return and the buying and selling price difference are not a simple linear relationship, but an exponential relationship. Assuming the price of asset A fluctuates between 100-500, we start from 100 and buy every 50 intervals. When this asset rises to 500, the rate of return curve is like this.
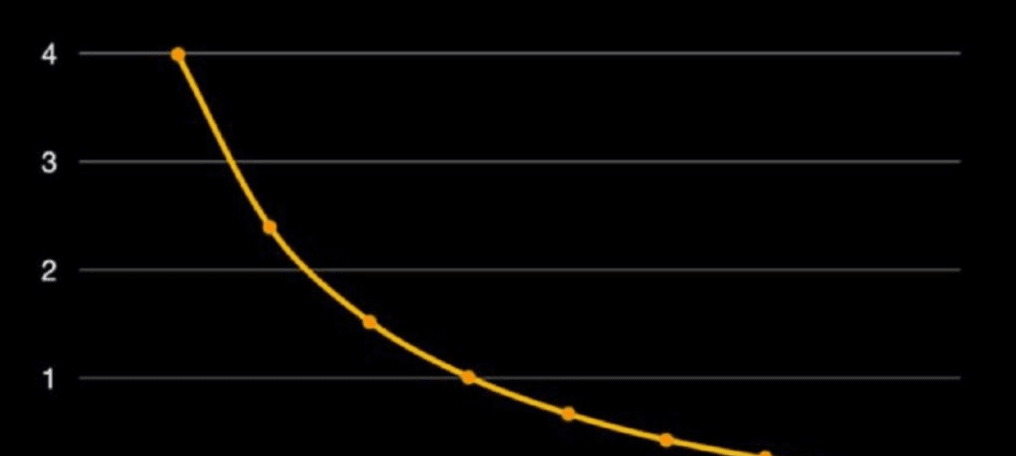
As can be seen from the figure, they all rise to 500, but as the purchase price rises, the rate of return decreases exponentially. The rate of return when buying at 100 is 400%, while the rate of return when buying at 400 is only 25%. The rate of return of the former and the latter differs by 16 times!
Looking at it the other way around, the asset is also fluctuating from 100 to 500. You still start buying in batches from 100. What is the loss when the asset falls back to 100? Let's draw a curve to look at it.
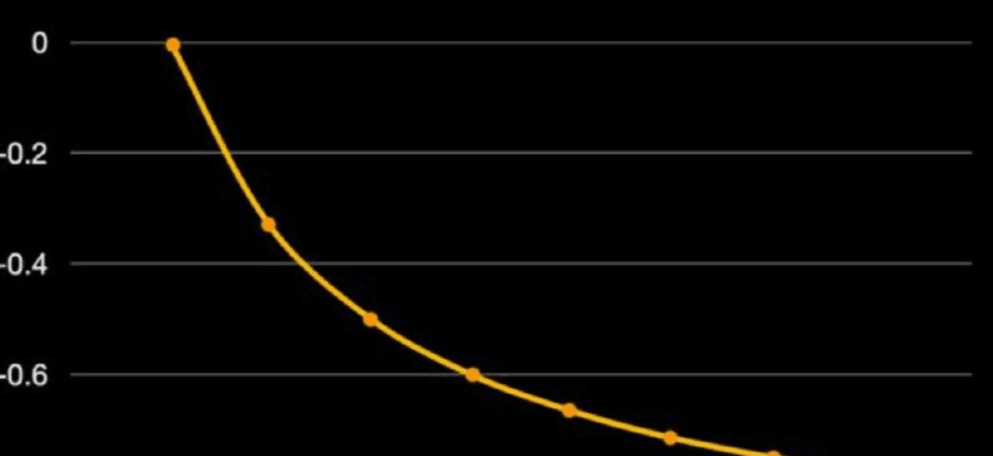
As can be seen from the figure, the difference between a low buying point and a high buying point is also obvious. A too high buying point will lead to very sensitive to price declines. At this time, if the price drops significantly, you will be forced to face the pain of losing all your capital and cutting your losses to the ankles.
Comparing these two curves, you will find that the essence of chasing highs and killing lows is losing money exponentially. This strategy must be abandoned, otherwise you will never have the opportunity to make money in this lifetime.
So, what standards should the correct choice of buying points follow?
I usually follow the "Two Points and One Area" method to confirm the buying point.
The two points are the highest and lowest prices on the x-axis in the curve. If you are good at valuation, then you can better find the price fluctuation range of the current asset, and take the reasonable highest and lowest prices you think are the two endpoints of the curve.
However, if you are not good at asset valuation, another simpler and more practical method is to look at the highest and lowest prices of the asset in the past year. Generally, the price in the past year is closer to the current actual value. However, if there was a bull market last year, you need to refer to the price from the year before to adjust and reduce the impact of the bull market price.
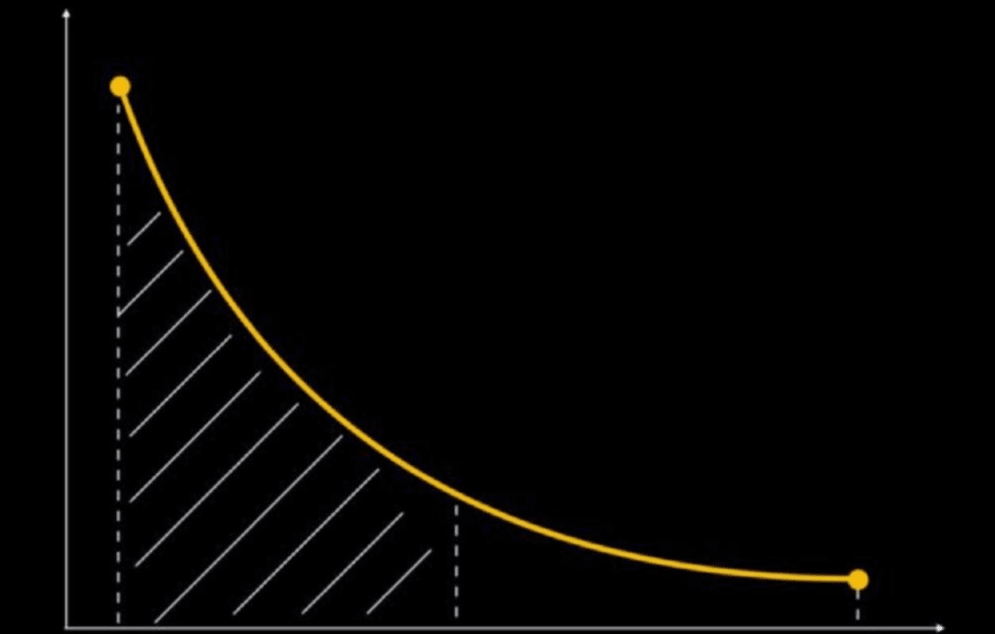
The one area in the two points and one area refers to the left half of the curve with the midpoint of the x-axis as the dividing point.
The trends of the return curve and the loss curve are almost the same. The left half of the return curve generally has a higher return rate, and the left half of the loss curve means that it has a better risk tolerance when the price falls. Since the middle part of the curve has a relatively large slope change, it is a wise choice to control your average cost basis on the left half of the curve.
After talking about the choice of buying points, let's talk about today's main event, selling points.
Choosing the selling point is actually much more difficult than choosing the buying point. Choosing the buying point well can only guarantee that you have the potential to earn high returns, but whether you can really realize the profits depends on how you choose the selling point and when to sell and cash out.
Some people play short-term and see profits of twenty or thirty points, take the profit and sell. Although this strategy can be profitable, when you encounter a big bull market that rises three or five times, you are destined to be left behind. You will be thrown off the bus at the beginning of the bull market, and an opportunity for financial freedom will be gone.
Some people play long-term, always wanting to wait for the real bull market before selling and cashing out. This strategy also has flaws. On the one hand, the returns of small cycles cannot be captured. On the other hand, even if the big cycle really arrives, it is very likely that they will not sell and cash out in time due to wishful thinking. This can only be a roller coaster ride to the end, and it will all be in vain.
So, where is the best selling point? How to balance short-term and long-term returns?
The answer is hidden in the martial arts secrets of the Nine Yang Manual in (Heaven Sword and Dragon Saber). The original text is like this, everyone understand it:
Let him be strong, let him be strong, a gentle breeze拂抚过山岗.
Let him be arrogant, let him be arrogant, the bright moon shines on the Yangtze River.
He is ruthless, he is evil, I have enough true qi!
What does that mean?
It means that no matter whether the market is bull or bear, rising or falling, it doesn't matter. As long as I make a good strategy, the return cannot escape.
Therefore, if we want to find suitable selling points, we must abandon market interference, start from our own expectations, change from passive to active, don't cater to the market, and control the market.
The selling strategy I'm going to talk about next is an active strategy. The real selling point isn't just a single point, but a line.
If you want to get this line, you must first determine a basic expected return, such as 50%, and then set an optimistic expected return, such as 300%. Sell every time the basic return doubles, and ensure that all assets are sold and realized when the optimistic expected return is reached.
There are 6 selling points in total from 50% to 300%, which are 50%, 100%, 150%, 200%, 250% and 300%. After the selling points are determined, how much do you sell each time?
Small cycles cannot bring particularly large returns. Mastering large cycles is the core strategy, so my suggestion is to sell according to the exponential function curve.
We can split assets according to the power of 2 exponential function. If there are 6 selling points in total, we can add from 2 to 26, for a total of 126. Then I will divide the assets into 126 shares. When we reach the nth selling point, we sell the number of shares corresponding to the power of 2 exponential function. Assuming I have 63 Bitcoins in total, then each share is 0.5, and the number of sales corresponding to each selling point is this curve.
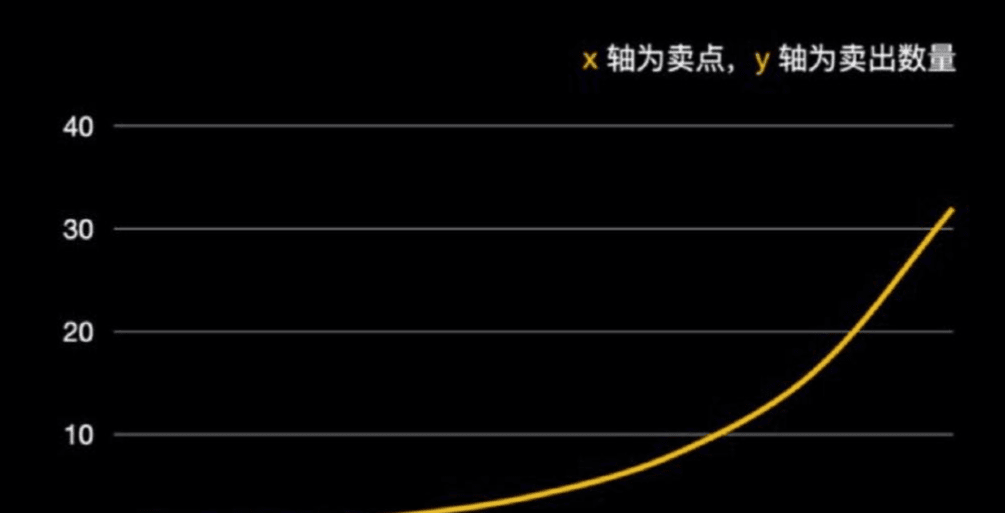
If you sell according to this curve, you won't return empty-handed in small market conditions and can earn some profit. When you encounter a large market condition, the power of this curve is enough to make you earn a lot of money.
If we look at human development on a 10-year time scale, humanity has been progressing in recent centuries. I believe that this trend will continue in the next decade, and even the decade after that.
As an investor, don't try to predict the future before the time machine appears. What we can do is exchange time for returns. As long as the assets and strategies are chosen correctly, time will eventually give you what you want.
My Cryptocurrency Market Trading System: Cycle and Sequence
1. Cycle is the time cycle. Roughly divided into 1 minute, 5 minutes, 15 minutes, 30 minutes, 60 minutes, 4 hours, daily line, weekly line, monthly line, annual line... I think I mentioned before that most indicators and strategies are also applicable to different cycles. Why track and study different time cycles? It is to try to figure out what is happening in the current market, the macro environment, the micro environment, and the microscopic environment.
2. I think the most important meaning of tracking and studying time cycles is: in many cases, the low point will be accompanied by the trigger of a buying point in a small-level cycle.
For example, sometimes a structure at the daily line level does not form, but a structure at the 60-minute level does. "Structure" has position weight, and obviously this 60-minute structure can also be operable. But if you don't track and study the current structure of each cycle, it is easy to miss it.
3. The situation we most want to see is: at a certain moment, structures appear in all cycles. This is called "cycle resonance". This is an exciting sign and will have a much higher success rate and strength than triggering structures in a single cycle. But this situation is rare. The larger the cycle structure, the greater the reversal strength of the market. The smaller the cycle structure, the smaller the reversal strength of the market. The trend and structure conditions under different cycles constitute the basis for buying and selling.
4. I said before that "structure" is a left-side indicator and must be used in conjunction with the trend. It is of little significance to use it alone.
The greatest significance of "structure" lies in: using the turning force generated by the structure to help the K-line break through the trend.
So, isn't the word "relay" more appropriate? The problem is that the trigger frequency of large-cycle structures such as the daily line is too low. At this time, it is necessary to look for opportunities from smaller cycles, although the strength and influence time of small cycles are not as good as large cycles.
5. If the price is very close to the trend, then any structure formed by any cycle may eventually form a trend breakthrough; what if the price is a bit far from the trend?
It is possible that the structure of the small cycle will not eventually form a breakthrough, but the structure of the large cycle can; what if the price is particularly far from the trend? It is possible that the structure of any cycle cannot form a breakthrough. However, the appearance of "structure" is the standard for buying, so you have to buy. How to break it?
6. For this complex problem, my answer is: Refined position management.
"Simplify complex things, standardize simple things, and process standard things."
What is simplification? It is to list the possible situations one by one.
What is standardization? It is to make response clauses for each simple situation.
What is a process? It means that when you encounter a certain situation, you unconditionally follow the terms like a robot.
7. "Position Management" will be discussed in detail in later chapters. If there is one thing that is not precisely quantified in this 2.0 trading system, it is: the judgment standard of how "far" the price is from the trend. This judgment is very simple for me, but I also want to quantify this thing as much as possible, but there is really no way, this is related to different trading markets and different trading experiences. Don't worry, even if you can't be precise, it won't have much impact on the result.
8. Regarding the choice of time cycles, it depends on personal preferences and actual situations. This also includes the question of how to choose the cycle for drawing lines that someone asked the day before yesterday. Generally, I use the daily line as the main cycle, and smaller-level cycles to assist. I generally don't consider cycles below 30 minutes, so I don't need to spend too much energy on it. With this kind of cycle combination, you only need to look at it occasionally, and sometimes you don't even need to look at it for a few days. Just keep an eye on special nodes.
9. If cryptocurrency trading is a side business and you have no time to watch the market, choose the weekly or even monthly line as the main cycle for long-term trading, and use smaller-level cycles such as the daily line to assist. You may not need to trade even once a year.
If you use minute-level as the main cycle, such as 30 minutes, 15 minutes, 5 minutes, then it is ultra-short-term, which requires continuous market watching, and the requirements for trading execution will be higher, suitable for professional players. I will occasionally play it when I have the energy to allow it.
10. Sequence is a headache. Over the years of trading cryptocurrencies, I still haven't spent the time and energy to optimize this indicator. Although "Sequence" performs excellently in the stock market, I haven't given it any position weight. That is to say, no matter how accurate it is, I cannot use its trigger criteria to guide any position buying or selling operations because, in addition to not forming a trading closed loop, it has a fatal flaw: poor performance in unilateral market conditions.
11. Specifically, "Sequence" performs poorly in unilateral market conditions due to underlying logical flaws in programming. Once it fails, it makes the mistake of selling too early or buying too early. Additionally, its error correction mechanism lacks a statistical probability advantage.
This is a big taboo in trend investing and cannot be tolerated. Here, I don't want to talk too much about Sequence because: Its overall success rate is even more disappointing when transplanted to the cryptocurrency market, and it takes effort to optimize.
12. If it is well optimized and can reach the accuracy rate of the stock market, then it is a good helper for "structure".
Its greatest significance lies in: assisting in judging the formation of structures. Especially in a blunt state, if a "Sequence" trigger signal appears, then the probability of structure formation will greatly increase. I probably don't have the motivation to spend time optimizing it anymore. Not having it doesn't have much impact on the overall trading system. Interested friends can try it.
BTC ETH USDT


