During the daytime trading session, be highly vigilant for correction risks. The current market focus should be on the defensive situation around the key point of 4330.
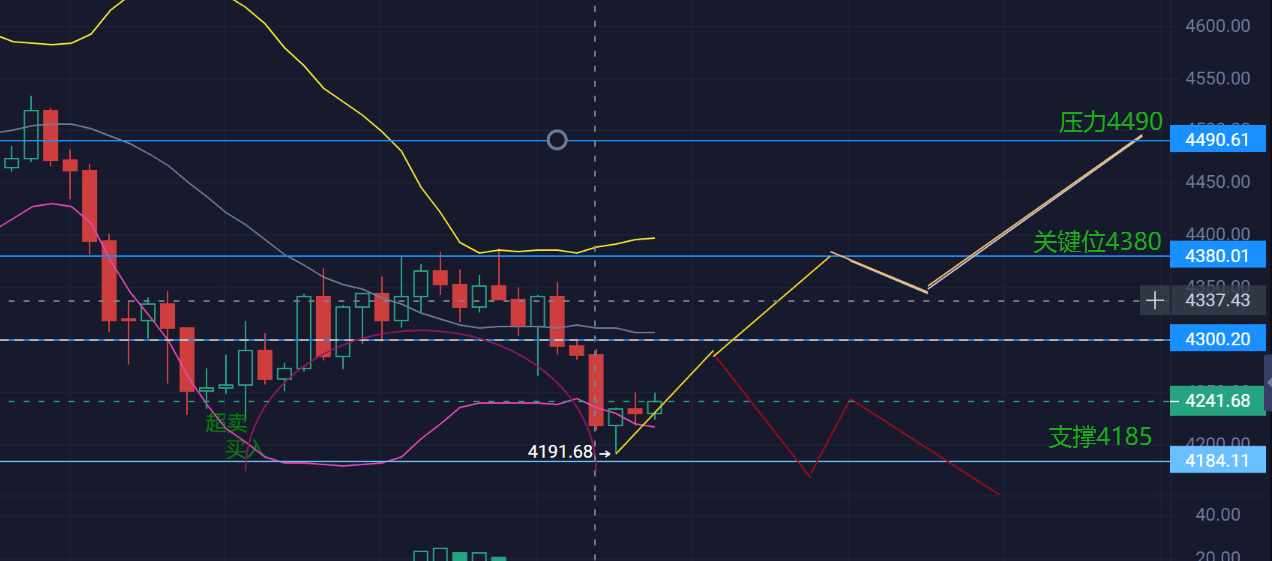
From a technical perspective, ETH's candlestick chart has significantly formed an inverted U-shaped characteristic of 'rising then falling', resembling an upside-down pot lid covering the price. The emergence of this pattern clearly indicates that the 4380 resistance level has strong resistance.
The bullish strength shows weakness when attacking this key position, greatly increasing the likelihood of a price correction in the short term.
Currently, 4330 has become a critical point crucial for the ETH market trend.
During the daytime trading session, if the price cannot even touch the key level of 4330 during the rebound, it will directly confirm the weakness of the bullish force. In this case, the market's bearish forces will likely increase their efforts, pushing the price further down, with the primary support level to test being 4240. If the 4240 support level also fails to hold, the price may further drop towards the lower level of 4180.
Conversely, if an unexpected situation occurs and the ETH price can stabilize above 4330 (using the 1-hour closing price as a judgment basis, the closing price must remain above 4330), then the previously formed inverted U-shaped technical pattern will temporarily lose its validity. At this point, the market trend will shift from the previous unilateral situation to a volatile pattern.
However, it is particularly noteworthy that even if the market turns volatile, the 4380 - 4490 range remains a strong resistance area, and the price faces significant resistance when attempting to break upward. There are hidden dangers in trading volume.
Volume increases when falling, but insufficient volume during rebounds (buy orders are sparse), indicating that funds are running away at high prices. If MACD also shows a death cross or reduced green bars, it acts as a catalyst for the decline.
Practical trading strategy:
Bears: Don't chase shorts near the current price of 4288! Wait for a rebound to the 4300-4320 area before opening shorts, set stop-loss above 4335, and target 4240 → 4180.
Bulls: Observe more, act less! If you really want to bottom out, wait around 4180 (provided it can drop to that), and you must see a long lower shadow on the 30-minute chart.
Day traders: Lock in the 4240-4330 range during the day, place breakout orders on both ends (short if it breaks below 4240 / go long if it breaks above 4330), and ride the trend.
A deadly psychological game:
The main focus now is on the trick of 'pressure zone false breakout':
First, pretend to rise to attract retail investors to chase up → then suddenly crash near 4380 to trap people → after the inverted U-shape forms, trigger panic selling.
Today's monitoring priority:
Price level 4330: The dividing line between bulls and bears; whether the day can recover will determine the tone for the entire day.
Support at 4240: The first touch is likely to rebound, but a second break will definitely see 4180.
If there is a sudden major positive/negative news, reassess the pattern and consider setting a price alert.
Currently, holding back is victory; wait for direction clarity before striking hard!
If you don't know what an effective breakout is, you can come to find me for guidance. Are you stuck? Don't know when to enter? Still the same saying, feeling confused and helpless about what to do, click on my avatar to comment. I need fans, and you need references.
Continued attention: #加密市场回调 #俄乌冲突即将结束? #ETH🔥🔥🔥🔥🔥🔥