
Making Blockchain Data Understandable
In the fast-moving world of DeFi, NFTs, and blockchain, transparency is critical—but traditional blockchain explorers often overwhelm users with dense tables and raw data. Bubblemaps solves this problem by transforming complex on-chain data into intuitive, interactive visualizations.
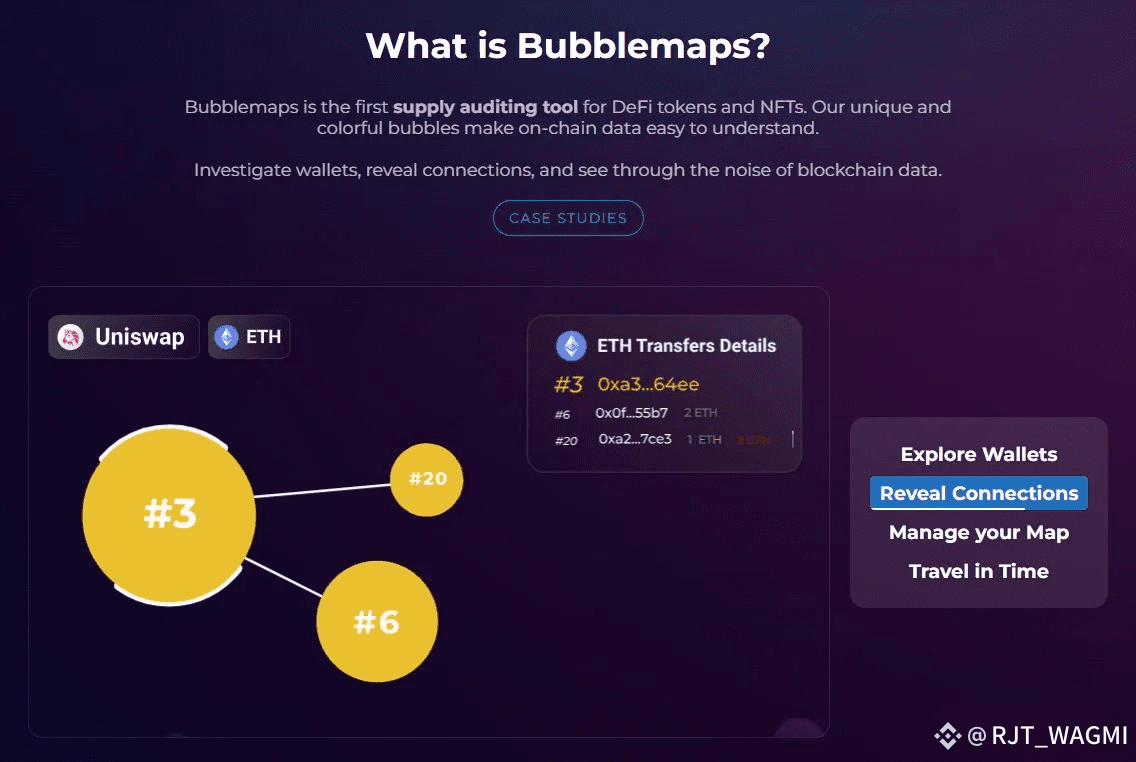
By representing wallet addresses as colorful, size-scaled bubbles and mapping the connections between them, Bubblemaps makes it easy to understand token flows, network activity, and ownership patterns. Users can quickly identify centralization risks, unusual activity, or opportunities in token distributions—turning raw blockchain data into actionable insights.
Key Innovations
Interactive Bubble Maps
The heart of Bubblemaps is its bubble visualization interface. Each bubble represents a wallet, with its size proportional to the amount of a token held. Connections between bubbles indicate transactions or relationships, allowing users to:
Track the movement of assets in real time
Spot clusters or unusual activity
Detect potential centralization or manipulative behavior
This visual-first approach simplifies analysis for investors, researchers, and developers, making blockchain data more accessible.
Supply Auditing for Tokens and NFTs
Bubblemaps acts as a supply auditing tool, helping users evaluate token and NFT projects. By analyzing distributions and wallet concentrations, it becomes easier to:
Assess decentralization levels
Identify red flags like whales controlling significant supply
Make informed decisions before investing
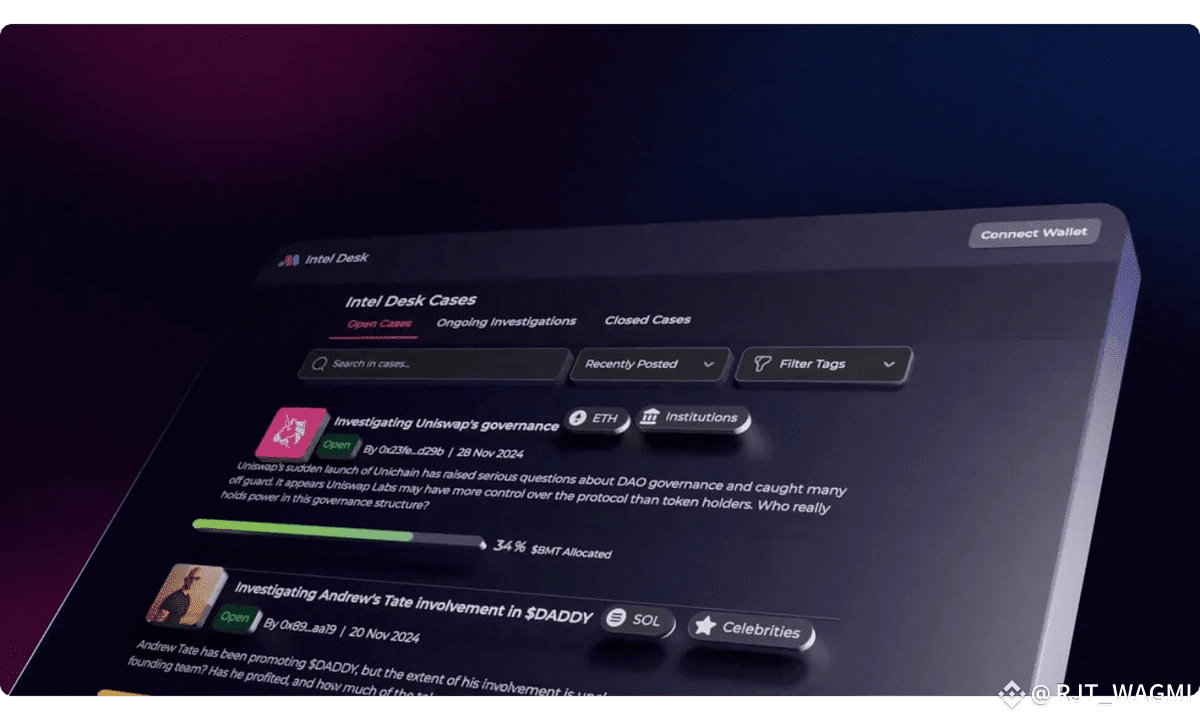
Intel Desk & BMT Token
For deeper analysis, Bubblemaps offers the Intel Desk, a suite of advanced investigative tools. Users can trace wallet connections, review historical transactions, and evaluate project risks.
The platform’s native token, BMT, powers access to premium features, governance participation, and staking rewards—ensuring a self-sustaining ecosystem for users who rely on advanced analytics.
Multi-Chain Support
Bubblemaps is cross-chain compatible, supporting Ethereum, Solana, BNB Chain, and more. This allows investors, developers, and auditors to gain a holistic view of the blockchain ecosystem, regardless of where a project resides.
Use Cases and Impact
1. Investor Due Diligence – Before committing funds, users can visualize token flows and wallet activity to identify centralized control or suspicious behavior.
2. Project Transparency – Blockchain projects can publicly share bubble maps, demonstrating decentralization and accountability, boosting user trust.
3. Regulatory Oversight – Regulatory bodies can leverage Bubblemaps to detect irregular activity, suspicious transactions, and potential money laundering, strengthening compliance in the blockchain space.
Why Bubblemaps Matters
Bubblemaps is redefining how we interact with on-chain data. By converting complex information into easy-to-understand visual analytics, it empowers users to make smarter decisions, fosters transparency, and encourages trust in blockchain projects.

Whether you’re an investor seeking clarity, a researcher analyzing tokenomics, or a developer ensuring project transparency, Bubblemaps provides the tools and insights necessary to navigate the blockchain landscape with confidence.
Stay connected: @Bubblemaps.io | #Bubblemaps | $BMT
