Sometimes, when we want to conduct a rigorous DYOR on-chain, we struggle with the difficulty of data retrieval—Are the holdings of DeFi tokens concentrated? Is the heat of an NFT project supported by genuine collectors or staged by a few wallets? Are there 'whale clusters' behind memecoins that could run away at any moment?
These questions were once exclusive topics for professional analysts, while ordinary investors could only rely on feelings and news for luck. It wasn't until Bubblemaps and its 'bubble magic' appeared that blockchain data transformed from 'aloof technical language' into 'interactive maps' that everyone can understand.
Bubblemaps is not a 'show-off tool', but a 'risk scanner' for the crypto world.
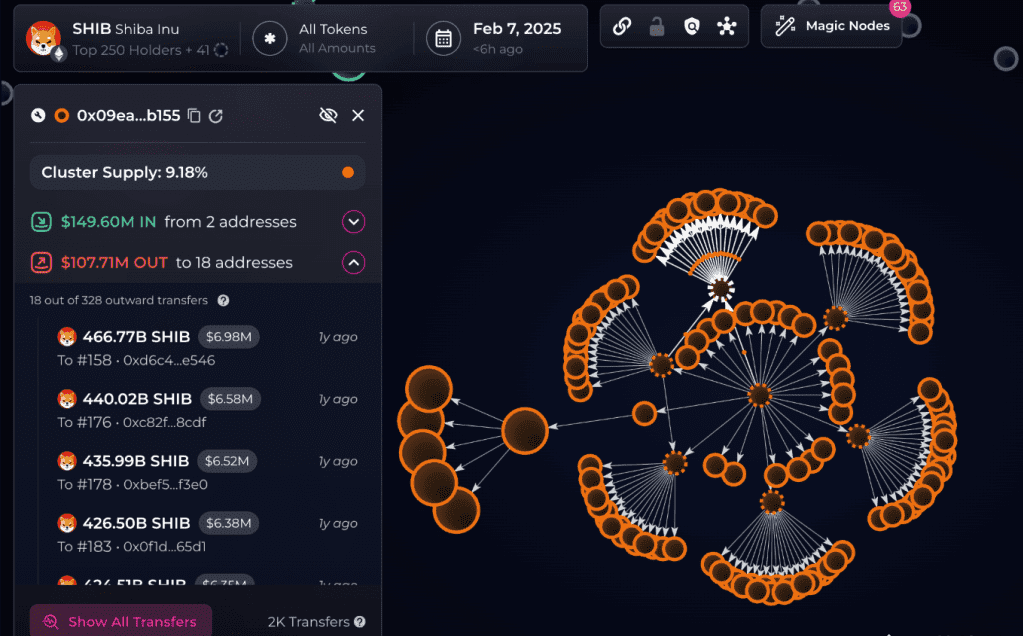
Compared to the 'data piling up' of traditional analysis tools, the core value of Bubblemaps lies in 'visualizing' abstract on-chain relationships—each colored bubble represents a wallet or token holding, the larger the bubble, the broader the scale, and the color differences directly distinguish types or risk levels. No complex code is required, and you do not need to understand the underlying logic of blockchain; just by staring at the screen, you can quickly capture key information:
The 'lightning shield' for DeFi and memecoin players: Previously, there was a popular memecoin on Solana that seemed to have a lively community and skyrocketing prices. However, someone used Bubblemaps to check and found several closely connected 'bubble groups'—these wallets not only held a high proportion of the assets but also frequently made small transfers to create a false sense of activity. This detail allowed many users to avoid the subsequent 'carpet crash' in advance, preserving tens of thousands of dollars in principal. Now, using it to view asset distribution and identify potential controlling wallets in DeFi token audits has become a standard practice for many.
The 'heat detection device' for NFT collectors: When buying NFTs, we always fear encountering 'volume manipulation projects'—for example, a series may appear to have stable floor prices and high trading volumes, but Bubblemaps can clearly show: if most NFTs are concentrated in 3-5 wallets and frequently 'swap hands', it could likely be money laundering or false activity. Some collectors relied on this to abandon a 'superficially popular' project, which later indeed exposed a team scandal involving volume manipulation.
The 'shortcut for DYOR' for ordinary investors: You don't need to learn programming to track transaction paths and assess project transparency. A novice trader analyzed a new DeFi protocol and discovered through Bubblemaps an abnormal bubble trail of 'the team wallet frequently transferring large amounts of tokens to unknown addresses', allowing them to abandon the investment in time and avoid a scam disguised as 'high returns'.
Future: Not just 'understanding data', but also 'predicting risks'
If we say that the current Bubblemaps is a 'microscope on the chain', what it aims to do in the future is to be the 'smart navigator' of the crypto world—along with the ecological landing of the native BMT token, more practical features are on the way.
No more need to 'watch the market constantly': The real-time alert feature will proactively remind you of 'abnormal transfers for tokens you are watching' and 'excessive concentration of holdings';
No need to 'find patterns on your own': AI-driven insights will directly tell you 'whether the collector structure of this NFT project is healthy' and 'whether the whale movements of a certain memecoin are risky';
It can even break down 'cross-chain information barriers': Future updates will integrate Layer2 and cross-chain bridge data, so whether you are operating on Ethereum, Solana, or other chains, you can see a complete on-chain picture in one place.
What’s even more exciting is that the team plans to incorporate machine learning capabilities—perhaps in the future, we won't need to analyze bubble trails ourselves; the tool could automatically identify 'wallet patterns similar to previous rug-pull projects' and predict risks in advance. In the long run, it aims to become the 'Google Maps' of the Web3 era: whether retail investors checking projects, institutions conducting audits, or newcomers learning about on-chain knowledge, they can clearly 'navigate' the blockchain world without worrying about being blinded by data fog.
Finally, I sincerely want to write to every crypto participant:
The core of blockchain is 'transparency', but this transparency should not only belong to a few tech-savvy individuals. The most appealing aspect of Bubblemaps is not how cool its visualization is, but how it makes the act of 'seeing the truth on the chain' equitable—whether you are a newcomer just entering the space or a seasoned player with years of experience, you can use it to avoid traps and make more rational decisions.
If you are also tired of 'investing by feel', you might as well try it: open the page, watch those jumping bubbles, and you'll find—blockchain data can be so simple; protecting your assets can also be this direct.
After all, in the crypto world, 'seeing clearly' is the most reliable sense of security. #Bubblemaps $BMT

