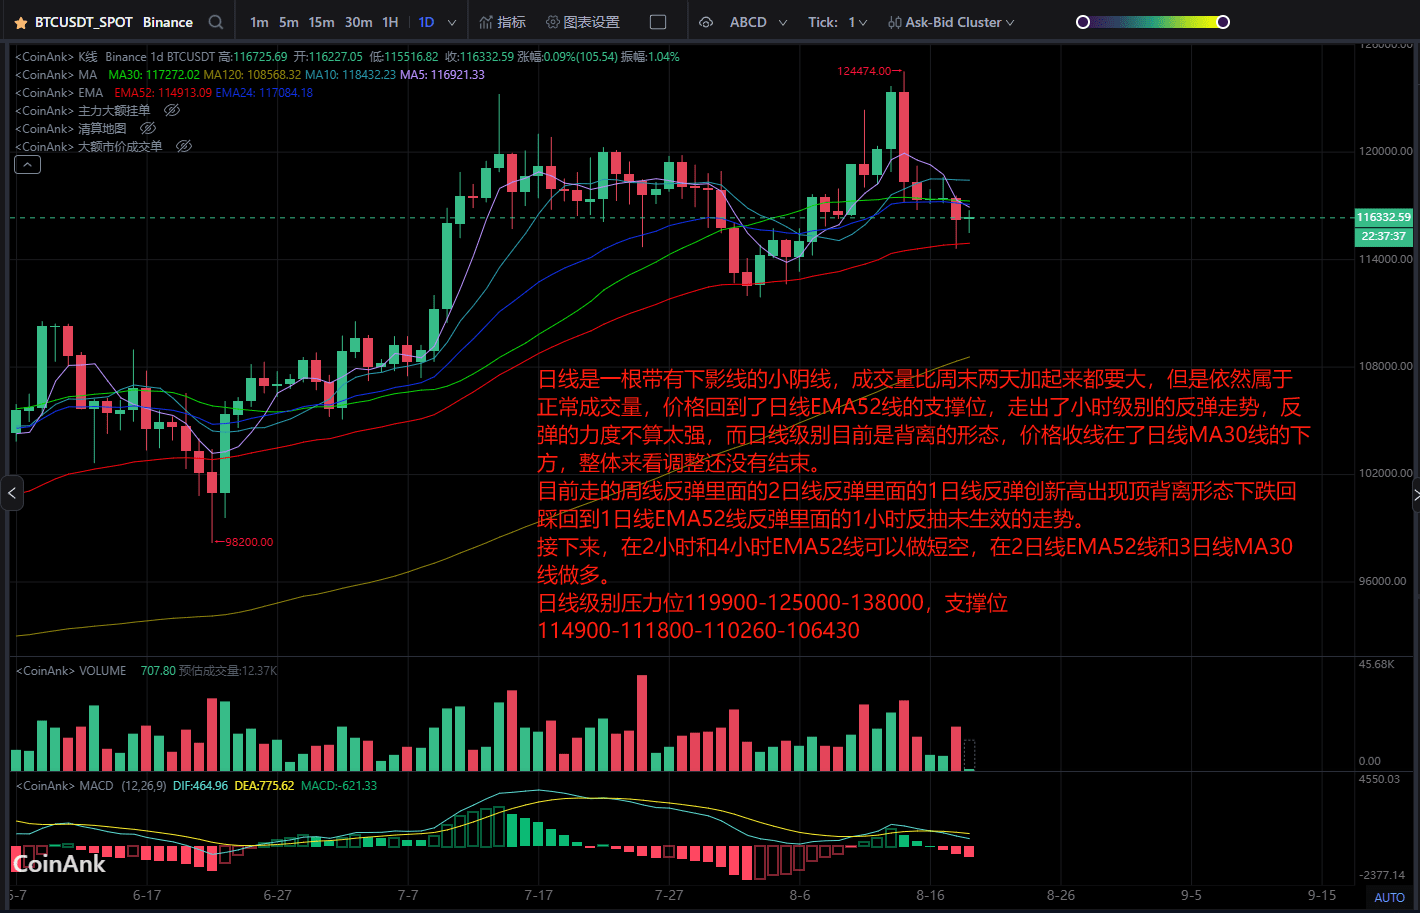
The daily chart shows a small bearish candle with a lower shadow. The trading volume is larger than the combined volume of the last two days of the weekend, but it still falls within the normal trading volume. The price has returned to the support level of the daily EMA52 line and has formed a rebound trend at the hourly level. The strength of the rebound is not very strong, and the daily level currently shows a divergence pattern. The price closed below the daily MA30 line; overall, the adjustment is not yet over.
Currently, the weekly rebound is within the 2-day line rebound, and the 1-day line rebound has reached a new high with a top divergence pattern. It has fallen back to the 1-day EMA52 line rebound, while the 1-hour pullback has not yet been effective.
Next, short positions can be taken at the 2-hour and 4-hour EMA52 lines, while long positions can be taken at the 2-day EMA52 line and the 3-day MA30 line.
Daily resistance levels are 119900-125000-138000, support levels are 114900-111800-110260-106430.