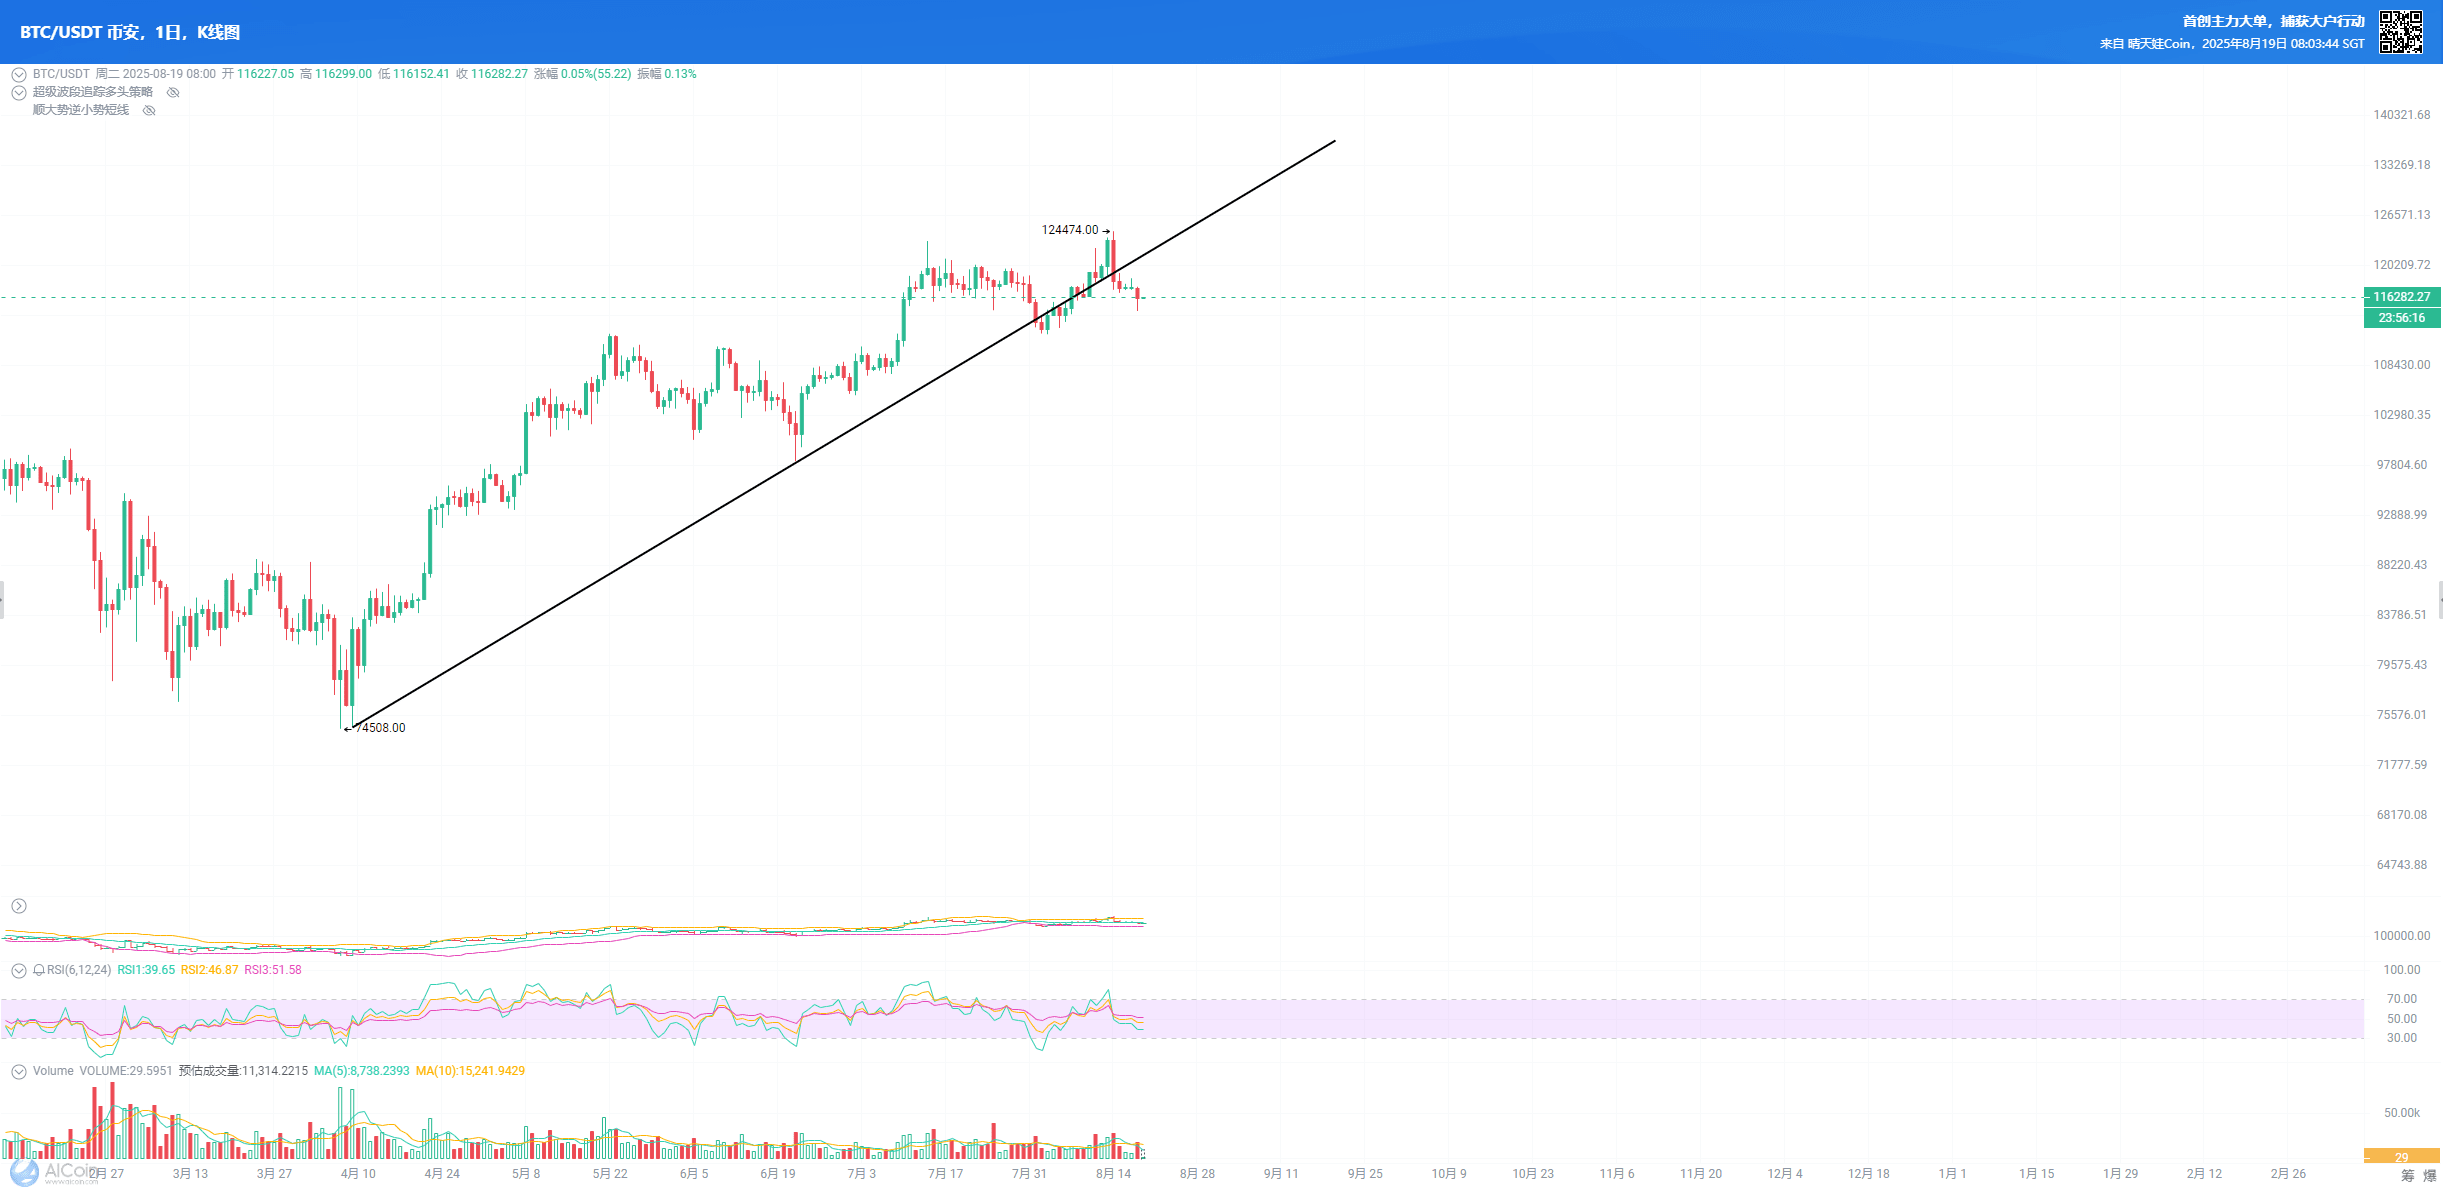
Bitcoin (BTC) trend line damage
Key trend line: The ascending channel connecting 74500-98200-113000 confirmed a breakdown on August 18!
Short-term support: The 6H EMA200 moving average is being supported, temporarily halting the downtrend, but the rebound momentum is insufficient and needs time to slowly recover. Then it will continue to fall and look for a bottom adjustment!
Where to take profits on the rebound long position, where to enter short position, trading and being smart should be something you can tell just by looking at the chart. Where to take profits on the downside needs to be calculated!
Although I already understood in my heart, I chose to remain silent now.
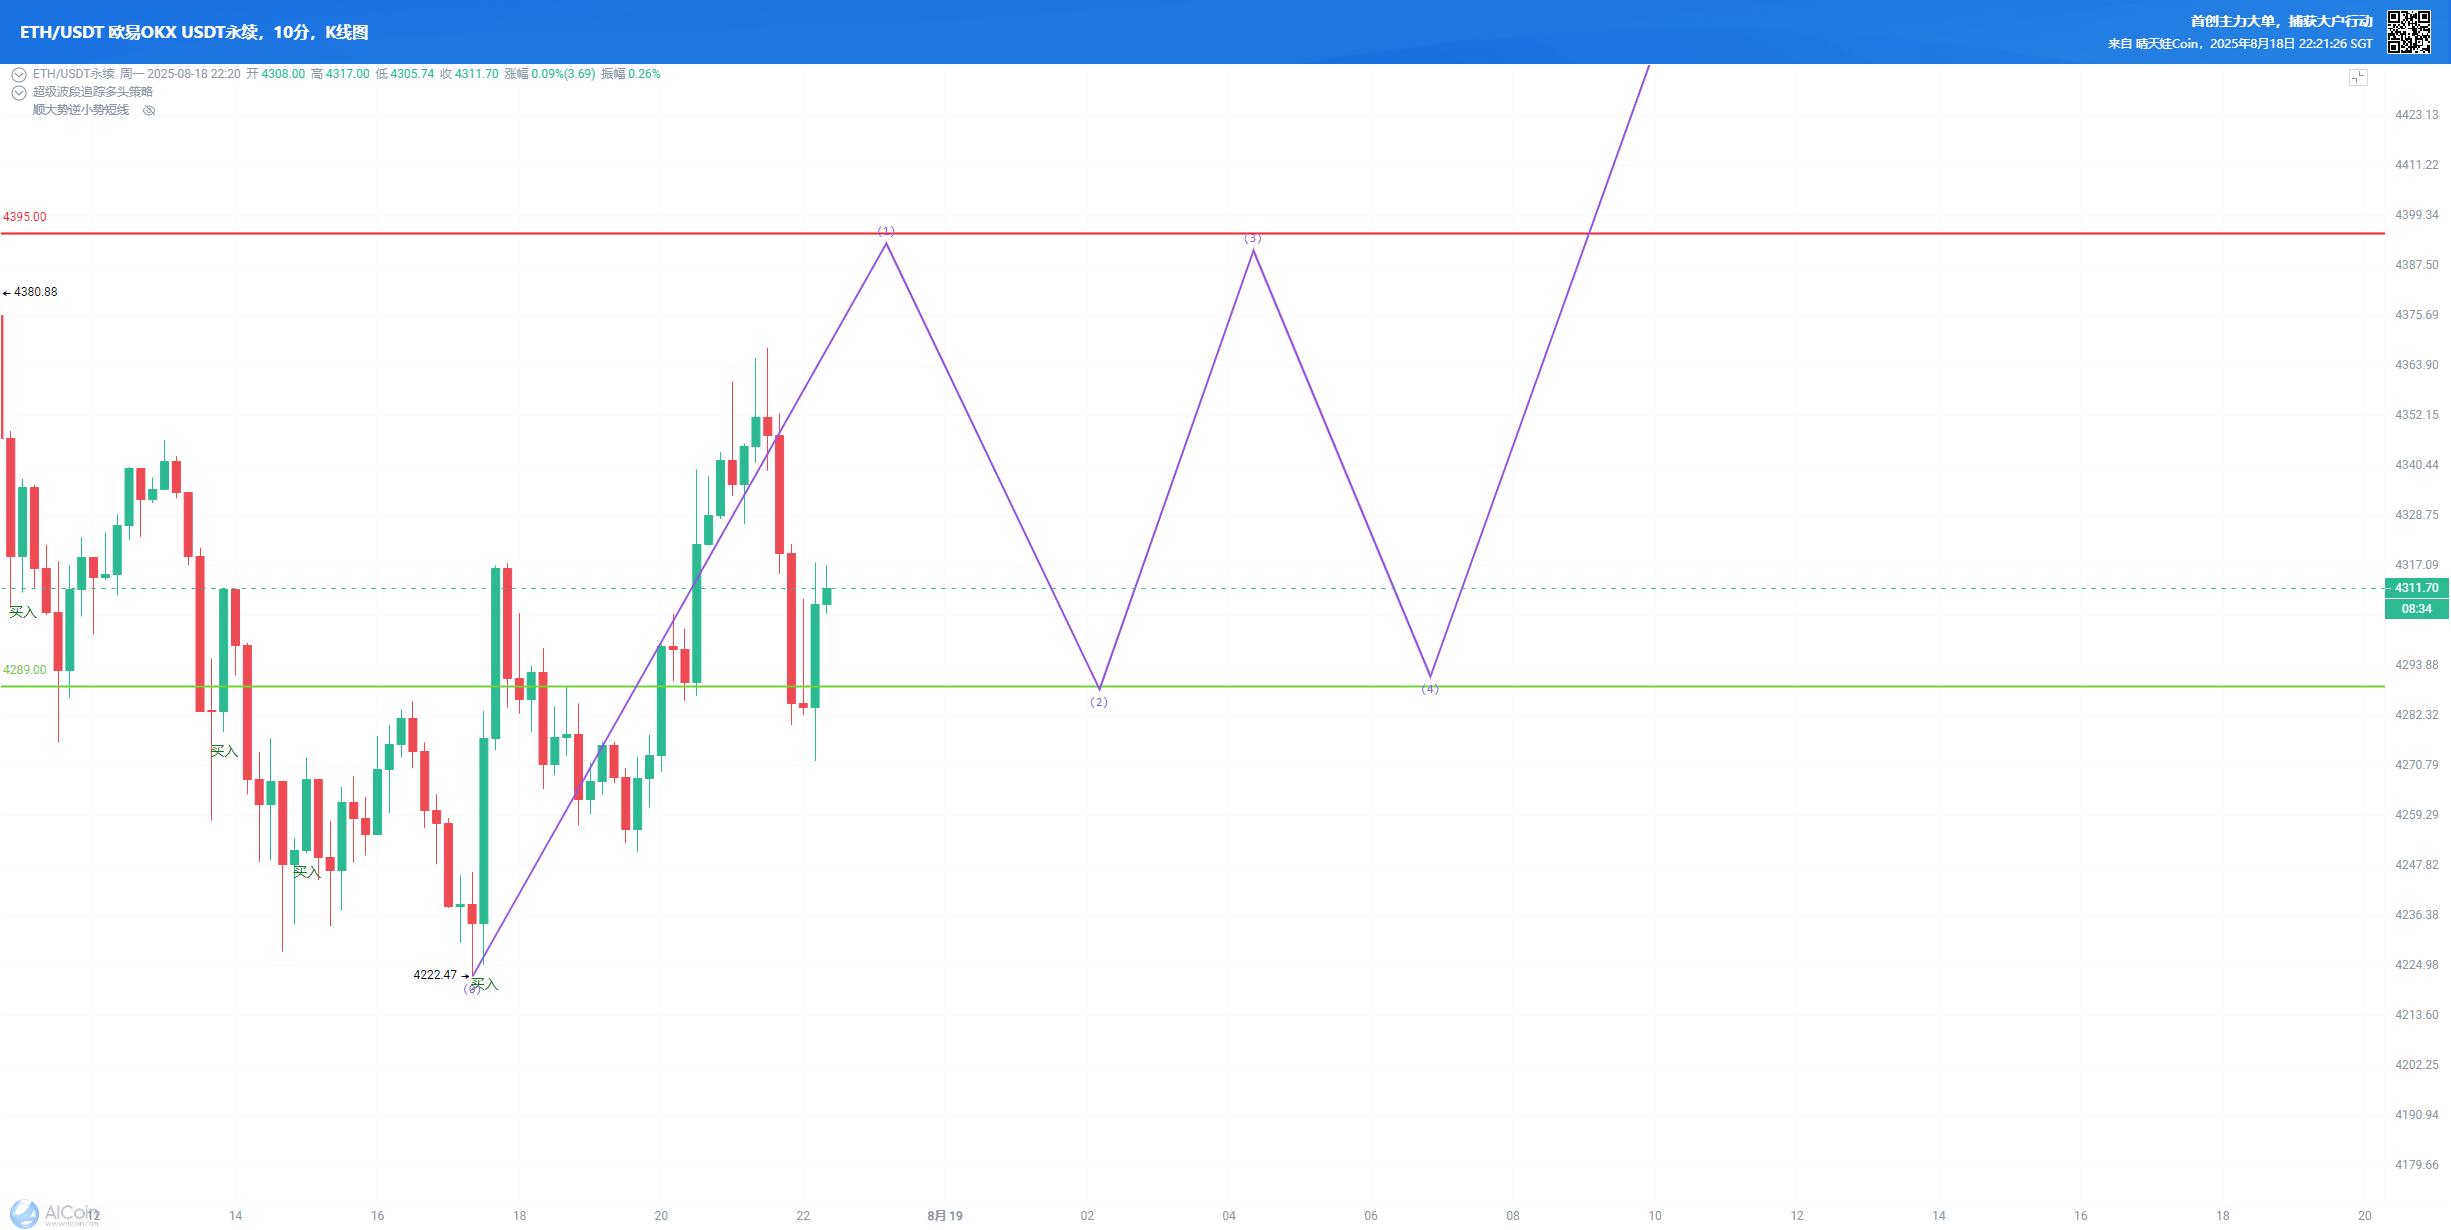
Ethereum (ETH) key level attack and defense review
1. Analysis of the loss of support level 4320
Bull-bear dividing line: 4320 serves as the last defense line of the 5-wave upward structure. Breaking below here officially declares the end of the small upward 5-wave structure, and then we will see if the market maker gives you an M top, ending with a big wave!!!
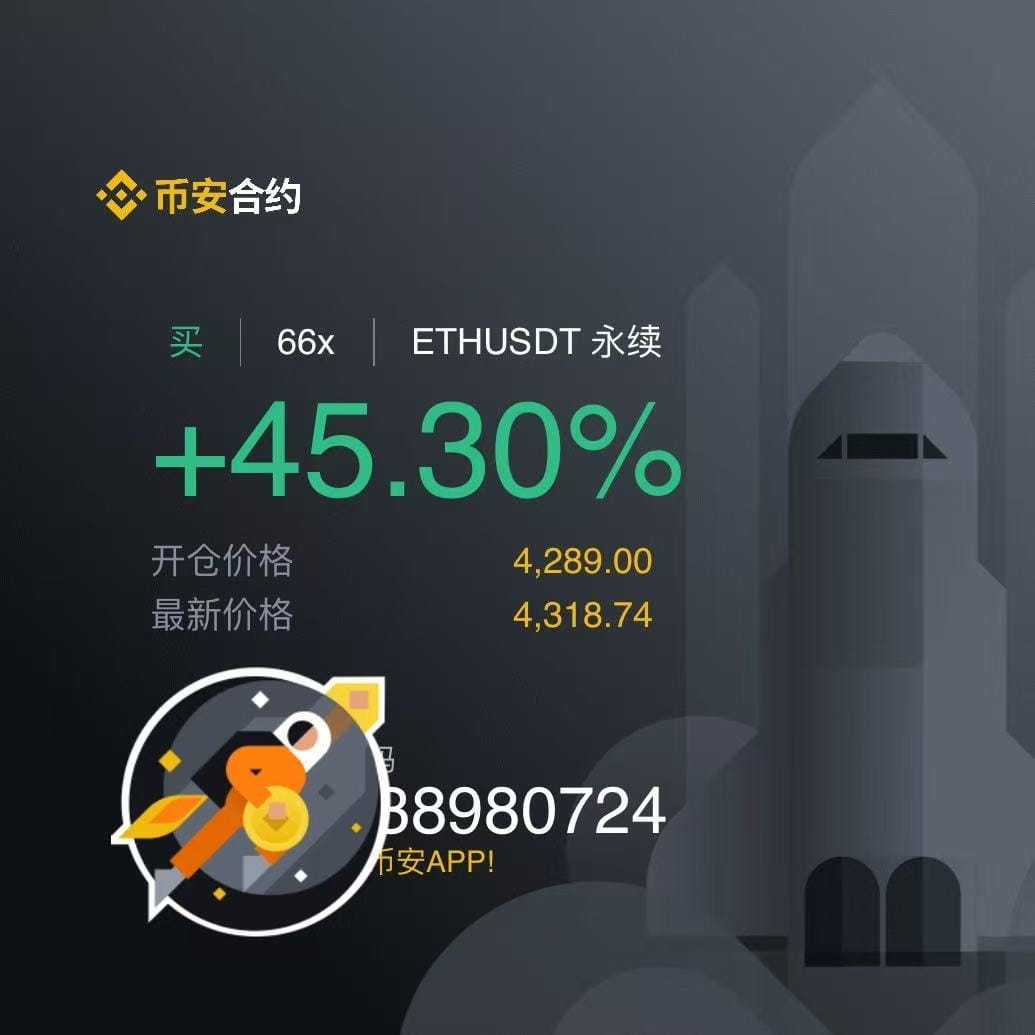
The first time here at 4320, no matter how it goes, it's time to go long. What I didn't expect was that the market maker dropped directly to 4225 after hitting two structure points.
At the moment the candlestick hit 4225, I understood. It was even more impossible to cut losses at the bottom here. In fact, I felt a bit scared at that time, with only 4180 left below!
My position in the account is very light. If it's a fixed ratio model, the liquidation price is around 4000. However, there is a problem here; there are many follow traders and some with 10U. I remember I had removed some 10U users, and the amounts differ too much, making it difficult to adjust the position.
Yesterday at noon before going to sleep, the price on the hourly chart closed at 4320, so I went to sleep more assuredly, then withdrew the hard stop loss at 4300. I was worried the market maker would spike down before pushing up in the afternoon! I have experienced many such stop losses!
Breaking below 4320 down to 4225, then rebounding to the 4320 area, once at 4320, it pulls back 70-80 dollars. This market is quite simple, testing support and resistance. This position has changed from support to resistance. Support and resistance swap positions.
After I got home at night, I drew this sketch, the upper right corner has the time, and also some small scale trends. Are you watching if it is in a sideways trading range? I drew this before the candlestick pattern came out! I don't need to analyze where the range is with the candlestick pattern.
I also shared with my cryptocurrency friends, but I don't want to post it publicly! The verbal attacks are too heavy; I can only earn! I cannot afford to lose! I can't do it; I am not an eternal earning PhD!
But I have ideas, and I am confident I can turn it around, although this is not advisable.
Prediction of the oscillation range
The current range of 4289-4395 has formed
3 effective tests on the upper edge (4395)
2 times retesting the lower edge (4289)
In line with the 'breakthrough after 2-3 swings' bottom construction characteristics
So, do you see if the market is sideways here, following the oscillation range I drew? Just go long at the bottom and short at the top, just leave a position waiting for the market to rise!
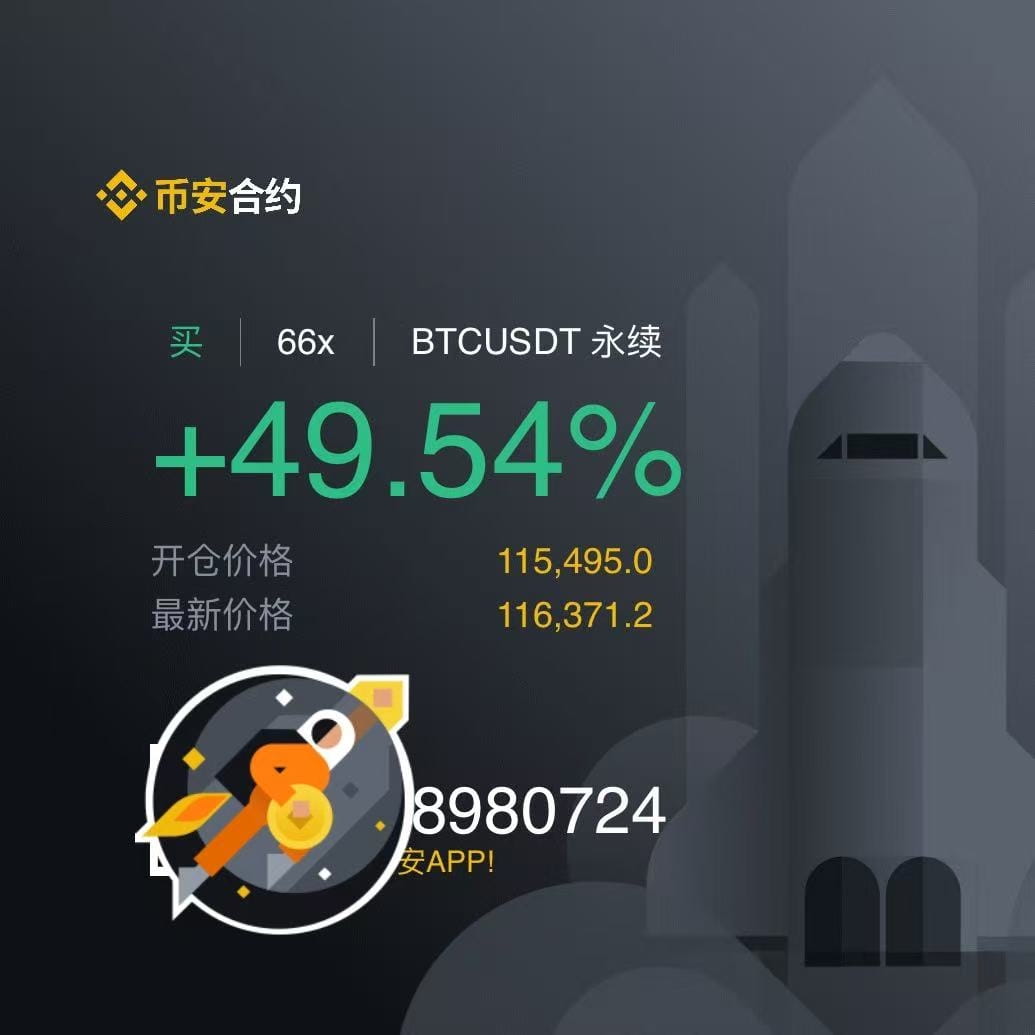
Big coin second time today in the morning getting in!