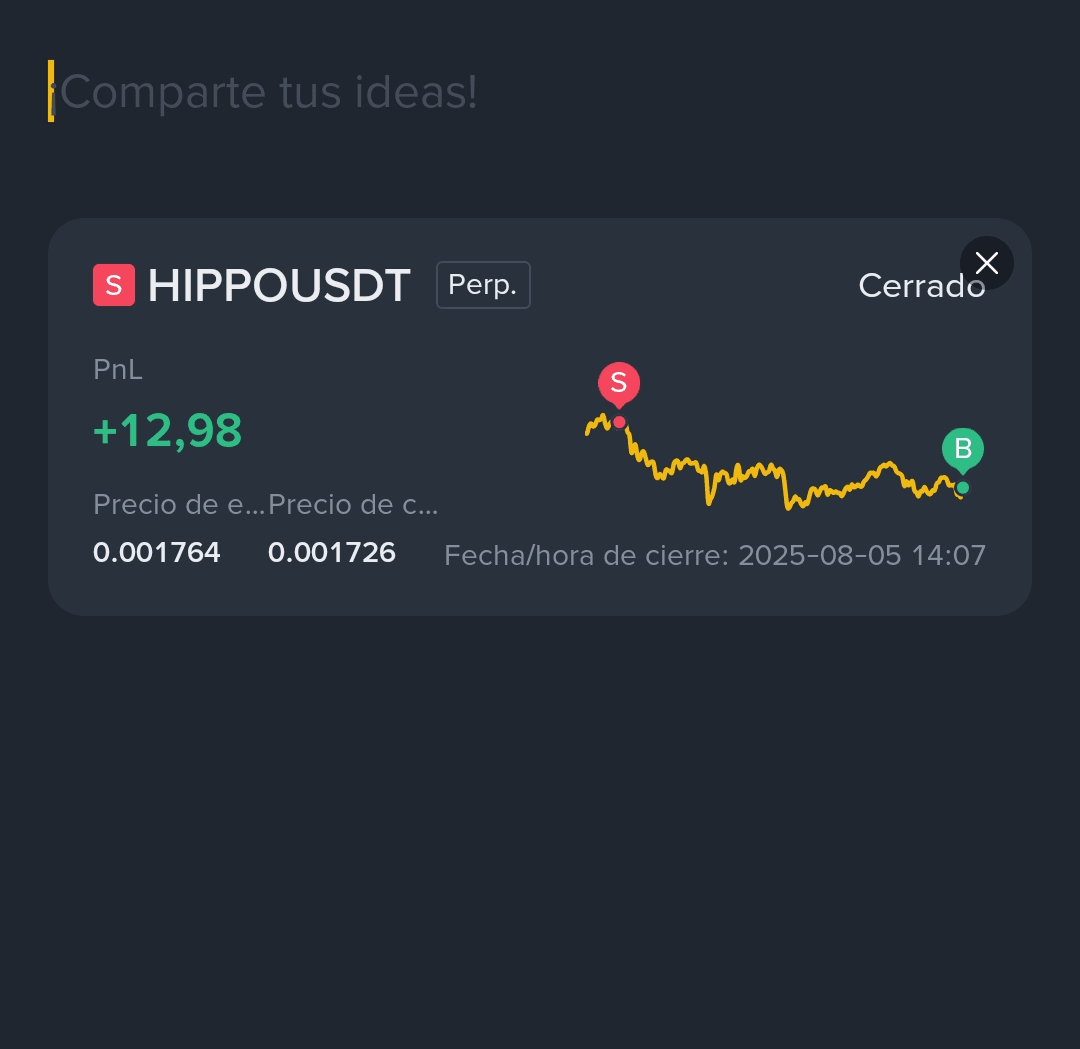
In the world of futures trading, well-applied simplicity can outperform any complex strategy. In this operation with #HIPPOUSDT , I achieved a precise entry that gave me a solid profit of +12.98 USDT or 25.96% (leveraged x15), a strategy that any trader can replicate with discipline and technical criteria.
📊 Key Tools of the Strategy
My approach is based on a combination of classic indicators and multi-timeframe analysis:
- RSI (Relative Strength Index): To detect overbought or oversold conditions.
- MACD: To confirm the momentum change.
- EMA50 and EMA200: To define the dominant trend.
- Supports and Resistances: Drawn on 1H chart.
- Execution on 5MIN chart: For precise entries and risk control.
👉🏻🧩 Step by Step of the Strategy
1. Analysis on 1H Chart.
- I identified key support and resistance zones, where the price had reacted previously.
- I verified the overall trend using EMAs:
a) If EMA50 is below EMA200, the trend is bearish.
b) If EMA50 is above EMA200, the trend is bullish.
2. Confirmation with Indicators
- RSI should be in an extreme zone (below 30 for buying, above 70 for selling).
- MACD should show a line crossover or divergence with the price, indicating a possible reversal.
3. Entry on 5MIN Chart
- I waited for the price to touch or break a support/resistance zone drawn in 1H.
- I confirmed with RSI and MACD on 5MIN.
- I verified if the price respected the direction of the EMAs in that timeframe.
- I executed the entry with a stop adjusted just outside the key zone.
📈 Trade Result
- Entry: 0.001764
- Exit: 0.001726
- Profit: +12.98 USDT (25.96%)
- Duration: Short term, ideal for scalping or intraday.
The key was to align the macro trend (1H) with the micro (5MIN) and wait for clear confirmations. No impulsive trading: everything was technical, visual, and systematic.
🧠 Final Reflection
This strategy does not seek to predict the market but to react intelligently to repetitive patterns. By combining classic technical analysis with precise execution, consistency can be achieved without getting complicated with hundreds of indicators.
Do you want to try it? Start by marking your zones on 1H with horizontal lines on the last 3 candles at their highs and lows considering the wicks, set up your #EMA200 and #EMA50 , and observe how #RSI and #MACD communicate with you. Patience and repetition are your best allies.


