

The leading altcoin, Ethereum, has shown a downward trend since the unsuccessful attempt to recover its historic record on August 13.
With the increase in selling pressure and greater profit-taking, the price of ETH has fallen 10% in the last five days and is expected to continue declining.
Ethereum bears gain control
The long/short ratio of ETH has reached its lowest level in 30 days, at 0.90, reflecting the growing caution of traders and a reduction in optimism.
This metric compares long and short positions in the market. When above 1, it indicates a predominance of bullish bets. Below 1, as is the case now, it points to expectations of a decline, reinforcing the bearish sentiment among futures investors in the coin.
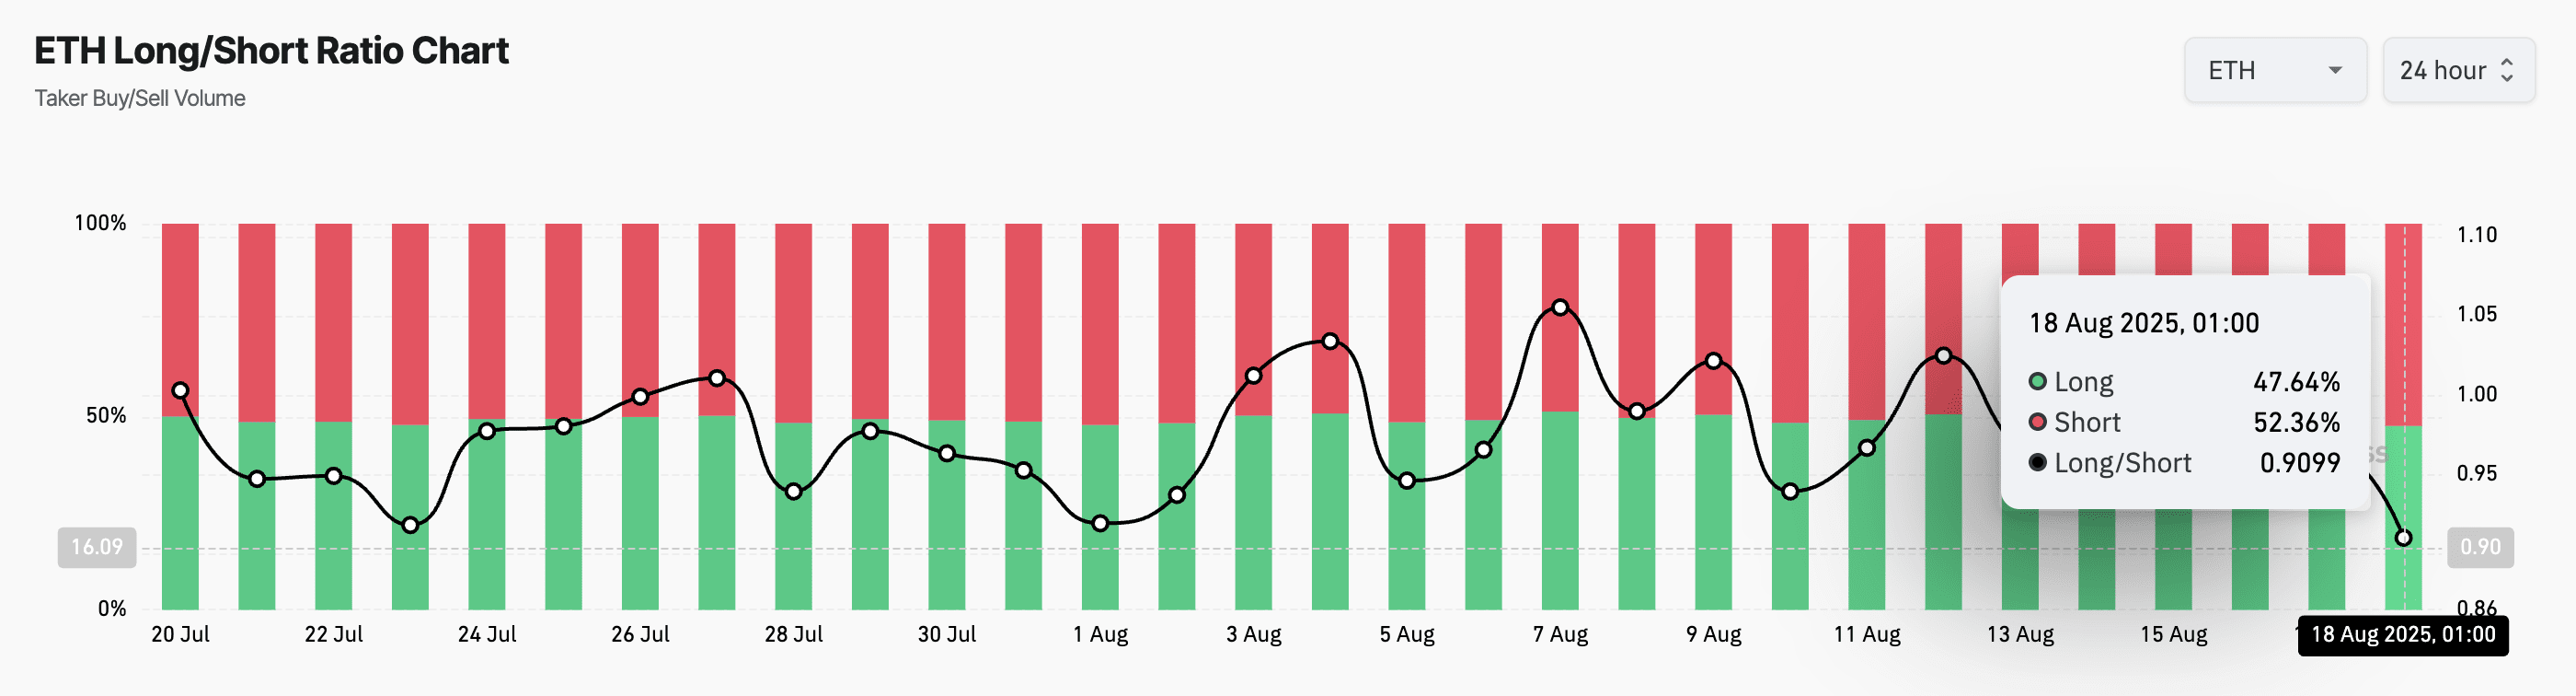 Long/Short Ratio of ETH. Source: Coinglass
Furthermore, the negative crossover of the Moving Average Convergence Divergence (MACD) indicator during today's session signals greater dominance of sellers. At the time of reporting, the MACD line (blue) is below the signal line (orange).
Pressure reinforced by technical indicators
The MACD is used to identify trends and momentum in price. Crosses below the signal line are considered bearish signals, as they indicate an intensification of selling pressure.
The recent movement suggests that ETH may continue facing consistent selling, increasing the risk of a decline towards support levels close to $4,000.
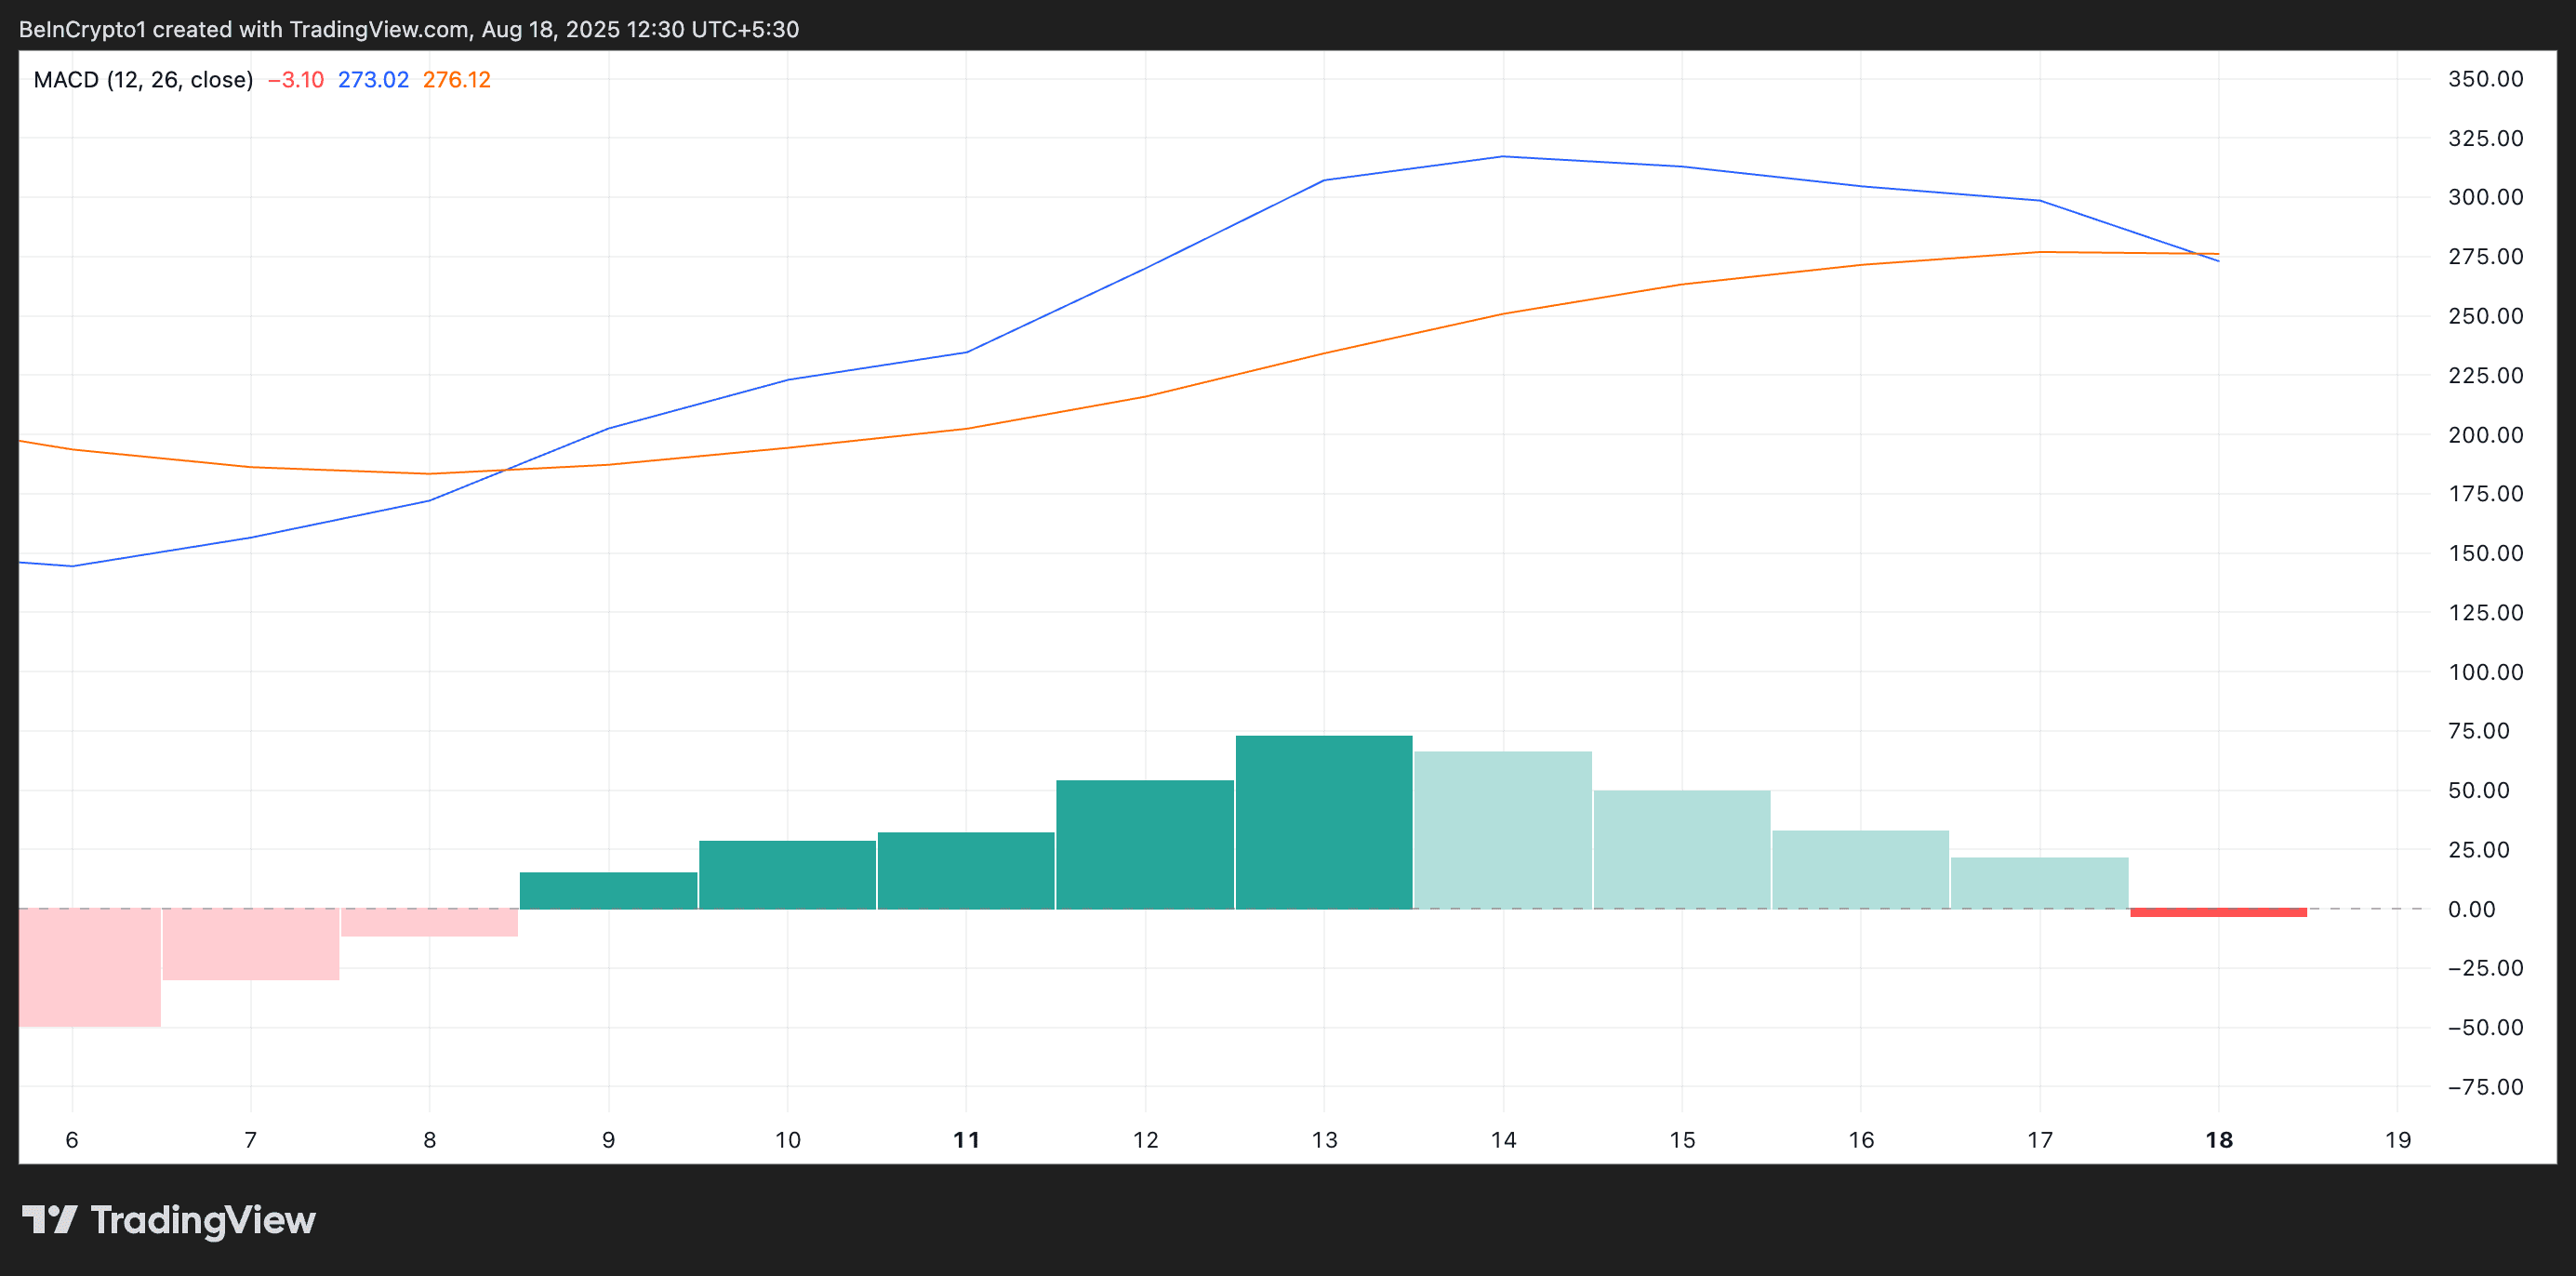 ETH MACD. Source: TradingView
ETH price faces critical test
Currently, Ethereum is trading at $4,224. If sales persist, the altcoin could drop to $4,063. If this support does not hold, the next defense zone is at $3,491.
On the other hand, if demand returns to the market, ETH could rise to $4,793. A breakout above this level would open space for the coin to retake its historic record of $4,869.
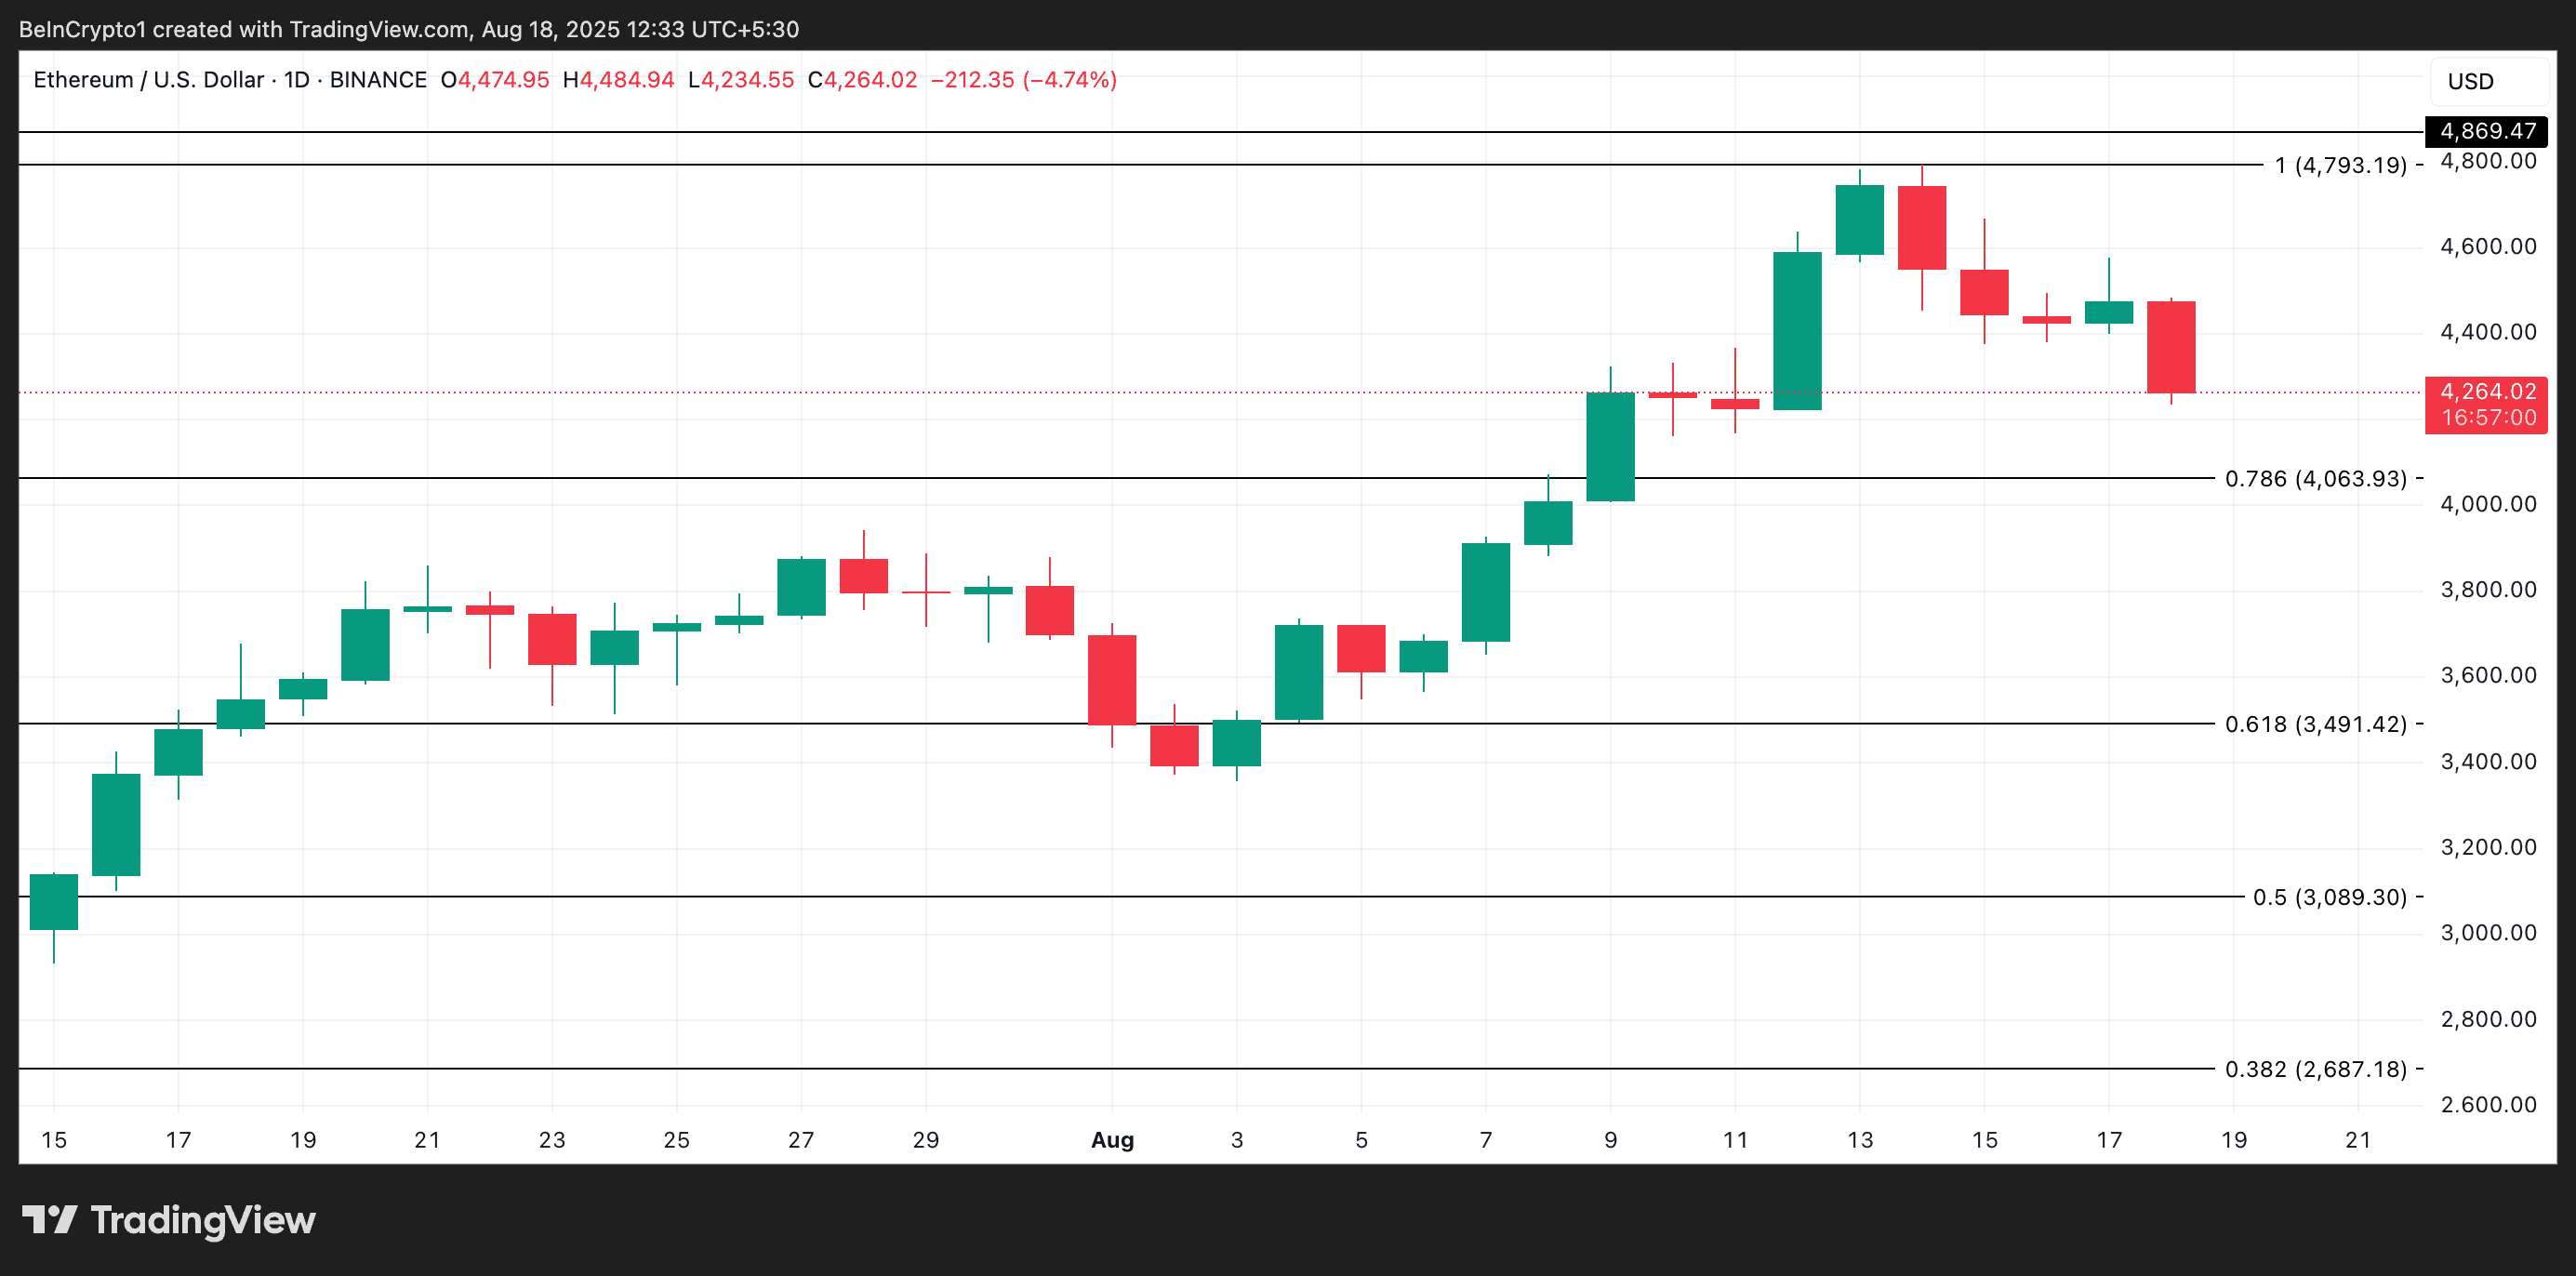 ETH Price Analysis. Source: TradingView
The article Ethereum under pressure: continuous decline may lead ETH to test critical supports was first seen on BeInCrypto Brazil.
