
Written by: arndxt, Crypto KOL
Compiled by: Felix, PANews
This is a liquidity-driven bull market, but not in the traditional sense of liquidity.
The Federal Reserve adopts a tightening policy, and the effects of fiscal stimulus gradually fade, yet risk assets continue to soar. Why? Because at the top tier of the economy, AI-driven capital gains and capital expenditures are decreasing layer by layer, while cryptocurrency treasury companies (TCos) have designed a new transmission mechanism that can quickly convert the optimism of the equity market into on-chain buying.
This flywheel can withstand weak seasonal factors and macroeconomic noise until super large-scale capital expenditure shifts or ETF demand stagnates.
My personal views are as follows:
Source of liquidity shifts: Not from the Federal Reserve or the Treasury, but from equity gains and capital expenditures of AI super large enterprises. The wealth effect of Nvidia (NVDA) and Microsoft (MSFT), coupled with a capital expenditure wave exceeding $100 billion, is radiating to the labor force, suppliers, and critically, retail portfolios, pulling risk out of the curve and into the cryptocurrency market.
New buyers of cryptocurrencies: TCos (like MicroStrategy for Bitcoin; Bitmine and others for Ethereum) are the bridge bringing public equity capital into spot tokens. This is the structural buyer that was lacking in the last cycle.
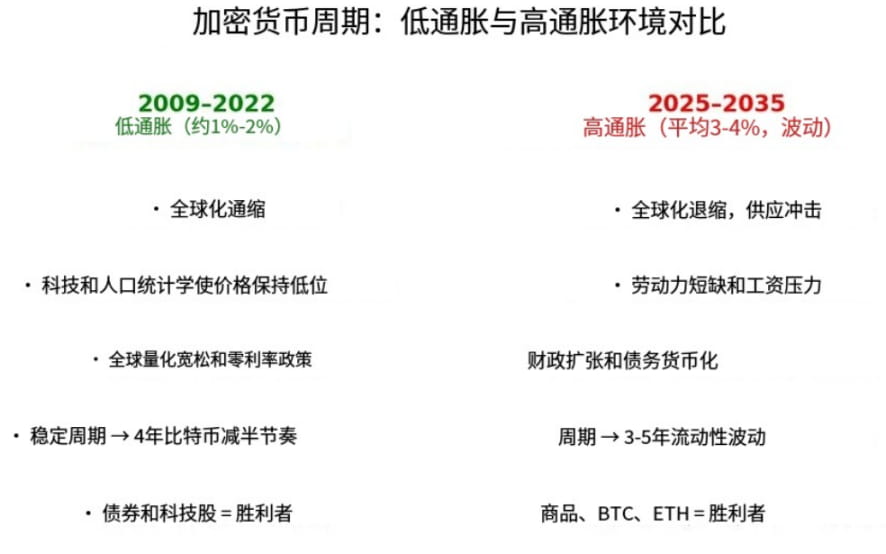
The current macro headwinds are manageable: Signs of sticky inflation risks (tariffs, wages, dollar) and weakness in the labor market are evident in macro data, but the optionality of AI productivity + favorable regulatory factors for cryptocurrencies are compressing risk premiums.
1) AI at the top of the pyramid
Capital gains → Risk rotation: As the S&P 500 index is overvalued (expected P/E ratio is high), retail funds are shifting to loss-making tech stocks, high short positions, and cryptocurrencies.
Capital expenditure as liquidity: Record spending by super large enterprises acts as a liquidity pump for the private sector, flowing to suppliers, employees, and shareholders, and then returning to the market.
Side effects: AI infrastructure construction (data centers, chips, power) currently manifests as investment growth, and in the future, as productivity improvement. Time lag → Wealth effect is immediate.
2) TCos = DAT
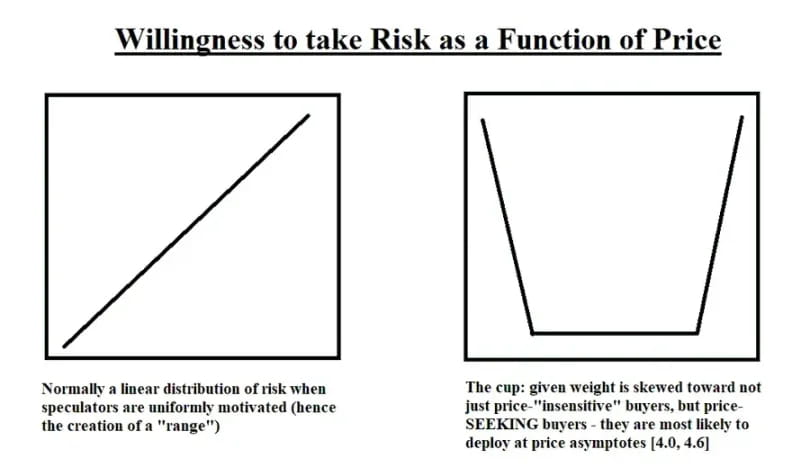
From 'first generation' to price-chasing TCos: Early TCos (like Saylor) were insensitive to price. The emerging ETH-centered TCos pursue price, defend key levels, and break through while accelerating upstream equity values.
Reflexive cycle: Equity financing → Purchase reserve assets (BTC/ETH) → Token price increases → TCos equity increases → Capital costs decrease → Repeat. This is the flywheel effect.
Fatal weakness: The gap between defensive levels. If ETFs/retail fail to fill the intermediate gap, failed breakout attempts will force traditional finance companies (TCos) to hold cash, and prices will quickly retreat.
3) Favorable policies and market positioning
The relaxation of cryptocurrency regulations and a friendlier stance have unlocked funding channels for traditional finance (TradFi).
Tariff 'solutions' are just a mirage: Companies still cannot accurately judge future tariff trends. Uncertainty leads companies to lean towards financialization rather than capital expenditure—more funds chasing assets.
Current state of Ethereum (and reasons for its rise)
After years of underperformance compared to L2, treasury demand + ETF inflows have brought a turning point for ETH.
'Cup theory' perspective: ETH trading companies (TCos) defend $3000, $3300 to $3500, and $4000; retail (ETF) needs to fill the intermediate gap. If approximately $27 billion in demand is realized in phases, the current market can continue. If not, price fluctuations (the gap at the bottom of the cup) will become an issue.
Personal view: The current buyer group of ETH has a structural change compared to previous cycles. It is no longer 'retail vs miners', but rather ETF + TCos vs liquidity gap.
Macro: The wall of worry (and why the market is rising)
Inflation
Surveying supply chain pressures: The sales price index has risen for three consecutive months (the highest since August 2022), indicating rising commodity price pressures, consistent with tariff pass-through, a weaker dollar, and wage stickiness.
Interpretation: An implied inflation rate of about 4% is not a crisis but will complicate rate cuts. The Federal Reserve can only tolerate growth-friendly inflation if there are no cracks in the labor market.
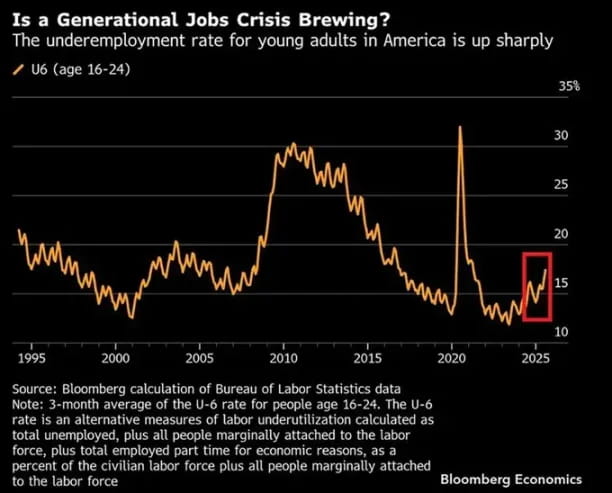
Labor force
The soaring youth unemployment rate in the labor market (around 17%, three-month average) is a warning sign in the early stages of the economic cycle. Young people feel the changes in the economic situation first; if this spreads to core employment sectors, risks will emerge.
Growth, debt, and AI
The fiscal offset effect of AI: If total factor productivity is 50 basis points higher than the benchmark level in the coming decades (AI scenario), by 2055, the ratio of public debt to GDP could be around 113%, compared to a benchmark of 156%, with per capita real GDP potentially 17% higher. In other words, AI is the only reliable growth lever capable of reversing the debt curve.
But the lag effect is important: The computer capital expenditures of the 1980s to the productivity boom of the late 1990s indicate that the popularization of AI takes time. Today, the market is underestimating future efficiency.
Tariffs and uncertainty
Policy fog = Valuation clarity risk: Uncertain tax rates, ambiguous agreements (EU/Japan), changes in exemptions, and legal challenges obscure future cost curves. This leads CFOs to prefer holding financial assets over long-term physical assets, ironically supporting the market while increasing mid-term inflation risks.
Bear market vs. Bull market
Bearish factors
Declining treasury cash balance + balance sheet reduction (QT) is still constrained.
Weak seasonal factors in September.
Early labor market shows signs of fatigue; inflation accelerates again (tariffs/wages).
Bullish factors
AI capital expenditure + wealth effect are the current sources of liquidity.
The shift in crypto policy has opened the funding gates of traditional finance.
TCos/ETF structure is a persistent mechanical buyer.
The dovish tendency of the Federal Reserve in 2026 is a credible forward-looking catalyst.
In summary: As long as AI → Retail → TCos → Spot remains intact, maintain optimism.
When will the change of mind occur?
Super large-scale capital expenditure decreases: AI infrastructure orders are significantly down.
ETF demand stagnation: Continuous fund outflows or failed secondary offerings.
TCo equity financing window closes: Decreased rounds of financing, failed issuances, or a crash in the ratio of premiums to net asset values.
Weak labor market: Weakness in the youth employment market spreads to the prime working-age employment market.
Tariff shock → Consumer Price Index: Commodity inflation forces the Federal Reserve to tighten policy again rather than cut rates.
Cycle positioning (NFA)
Core: High-quality AI composite enterprises; selectively hold key assets (computing, power, networks).
Cryptocurrency: BTC as a beta version, ETH as a reflexive flywheel. Emphasize defensive levels; assume there is a gap between the two.
Risk management: Adjust positions based on ETF flow data, TCo issuance calendar, and guidance from super large enterprises. Increase positions at defensive levels; reduce positions in frenzied breakouts lacking follow-through.
Summary
This cycle is different from 2021.
It is driven by private enterprise liquidity, which comes from AI equity gains and capital expenditures, transferring into cryptocurrency through new corporate structures, recognized by ETFs.
The flywheel is real; it will keep running until the top of the pyramid (super large enterprises) stops.
Before this, the path of least resistance remains upward (rising) and to the right (sideways).


