"♨️ShengTian®RSI Shift Channel🌀Momentum Divergence"
The indicator combines the Relative Strength Index (RSI) and momentum divergence analysis to help traders identify potential support/resistance areas and trend reversal or continuation signals. The indicator is divided into two main parts: shift zone and momentum divergence:
🅰. RSI Shift Zone:
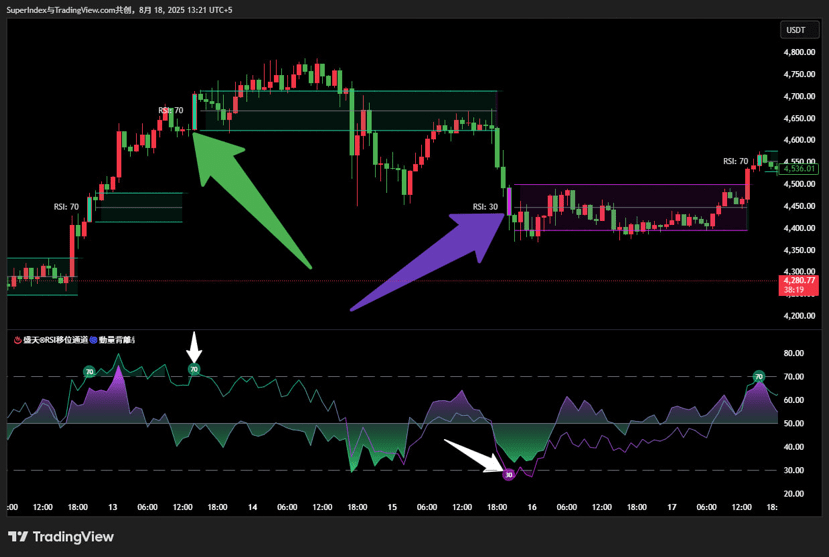
✤Based on the standard RSI, whenever the RSI breaks through or falls below key thresholds (default: 70 for overbought, 30 for oversold), a "shift zone" is triggered, drawing price channels (upper rail, lower rail, and average line) on the main chart. These channels are based on the highs and lows when crossing, lasting 15) K-lines, as dynamic support/resistance references.
 Drawing areas reveals where market sentiment may reverse, helping traders pinpoint powerful support/resistance clusters and breakout opportunities in real time. It is a sentiment change detection tool that connects momentum and price action.
✤The channel is color-coded to reflect bullish or bearish sentiment and dynamically adjusts based on whether the RSI breaks the upper or lower bounds. Labels for the actual RSI values can also be displayed within the region.
✤Key technical details
Detect crossings above the upper limit (trend strength) and crossings below the lower limit (oversold exhaustion).
Visually apply the channel on the main chart - providing traders with an accurate map showing where changes in sentiment have historically triggered price reactions.
Automatically clear the area when the minimum bar length is met and a new shift is detected. See the picture below👇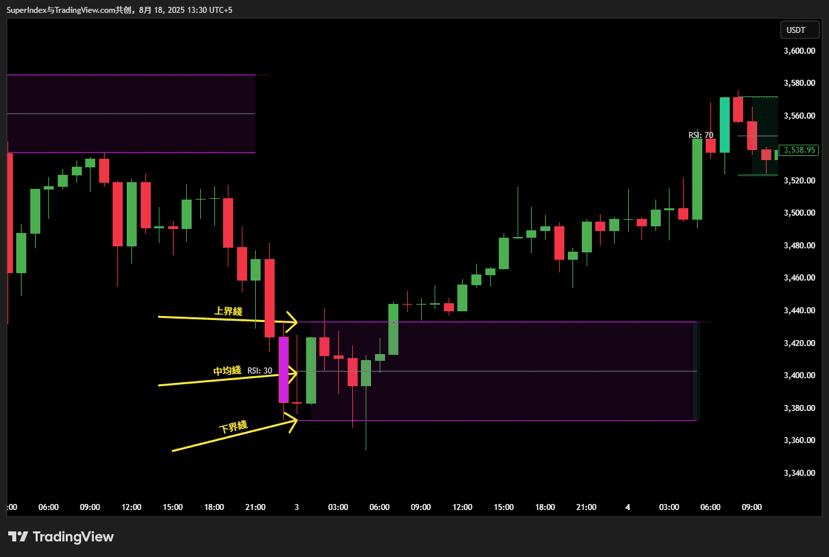
🔴The following details the core calculation logic
Price channel trigger conditions:
🔹Overbought Channel (channel_upper): Triggers an overbought channel when the RSI crosses 70 from bottom to top.
🔹Oversold Channel (channel_lower): Triggers an oversold channel when the RSI crosses 30 from top to bottom.
🚨Alert: Triggers an alert when the RSI crosses the upper bound ("RSI Overbought Channel Triggered") or the lower bound ("RSI Oversold Channel Triggered"), indicating potential overbought/oversold areas.
1️⃣. Upper Line:
Definition: When the RSI triggers overbought, record the highest price of the current K-line as the upper bound.
This line represents the high price when the channel is formed, representing potential resistance. In overbought or oversold areas, the price may have difficulty breaking through this level.
2️⃣. Lower Line:
Definition: Also when the channel is triggered, record the lowest price of the current K-line as the lower bound. Represents potential support. In oversold or overbought areas, the price may find support at this level.
3️⃣. Average Line: This gray line is the average of the upper and lower bounds. May serve as a short-term equilibrium point or trend reference point for price. It helps traders quickly identify the central axis of the channel and determine the price's position relative to the channel. See the picture below👇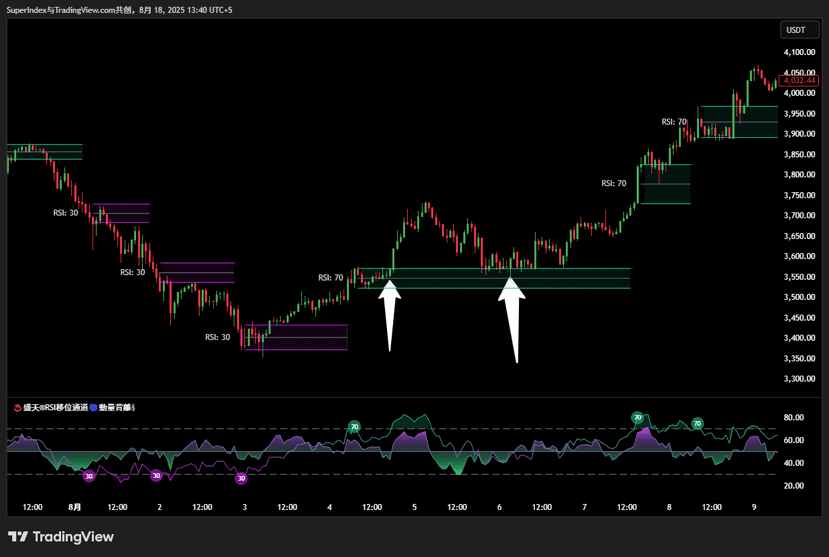
The midline can also be used as a balanced reference for pullbacks within the region and can quickly check if the region is forming due to extreme overbought or oversold conditions.
By projecting market sentiment reversals directly onto the price chart, simple RSI threshold crossings are transformed into a meaningful structural tool. This allows traders to see at a glance where momentum-based turning points occur and use these levels for breakouts, reversals, or high-confidence support/resistance area operations.
🅱️. Momentum Divergence:
✤The RSI Momentum Divergence Zone is a hybrid oscillator and chart overlay tool that detects momentum divergences in the RSI and projects them onto key areas on the chart. The indicator combines RSI divergence logic and horizontal line drawing to reveal high-probability support and resistance areas where price has historically reacted to hidden or classic divergences.
✤This tool does not use the classic RSI input, but uses price momentum as the RSI source:
This emphasizes the acceleration and deceleration of price movements, enhancing divergence signals and making them more sensitive to early shifts in momentum.
✤Regular Divergence:
➤Bullish Divergence (green): The price forms lower lows, but the RSI forms higher lows, indicating a potential reversal (buying opportunity). On the RSI panel, display the momentum RSI curve and draw lines and labels at the divergence point as: "Divergence▲" See the picture below👇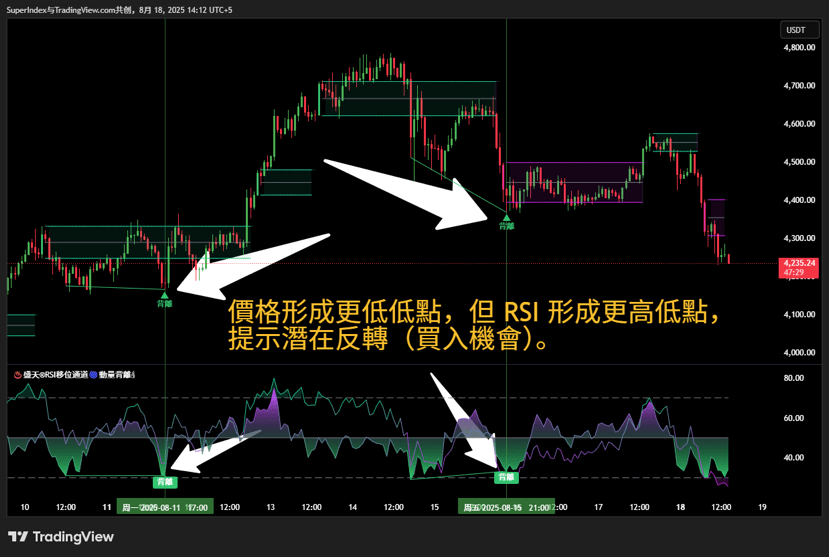
➤Bearish Divergence (purple): The price forms higher highs, but the RSI forms lower highs, indicating a potential reversal (selling opportunity). Draw lines and labels at the divergence point: purple "Divergence▼" See the picture below👇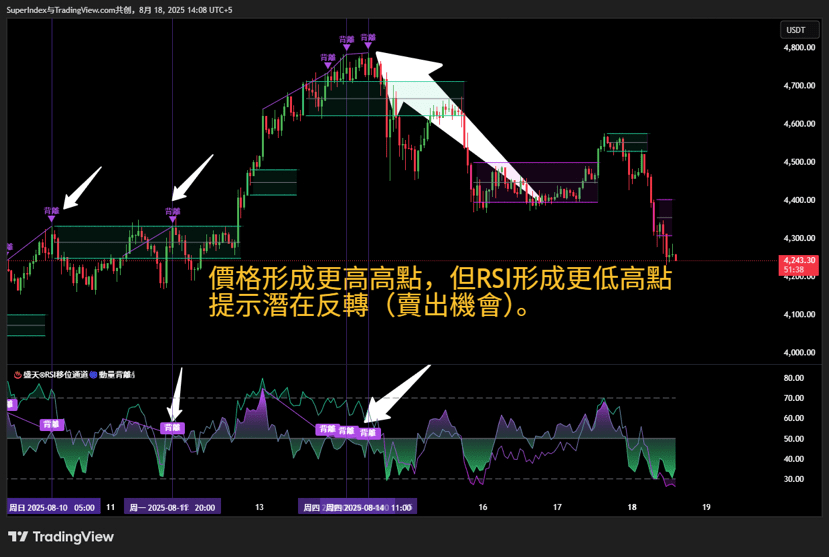
✤Hidden Divergence:
➤Hidden Bullish Divergence (blue): The price forms higher lows, but the RSI forms lower lows, indicating trend continuation (buying opportunity in an uptrend). Draw lines and labels at the divergence point as: blue "Hidden▲" See the picture below👇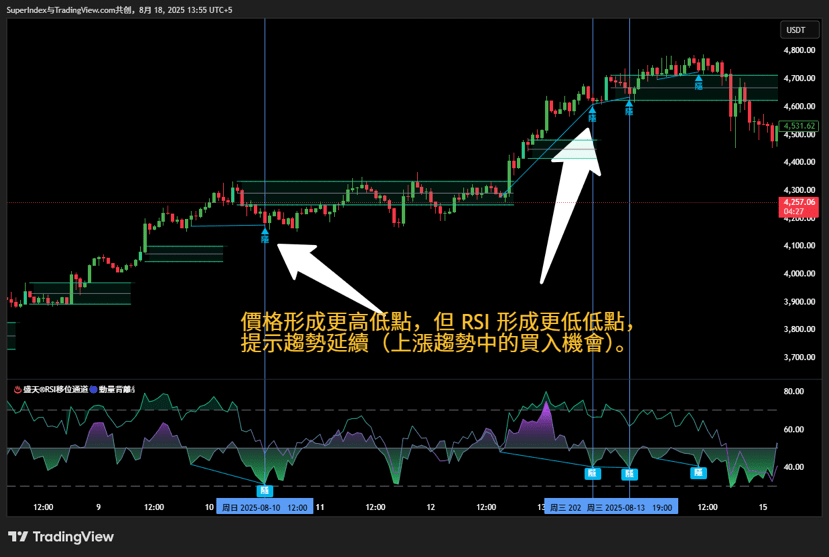
➤Hidden Bearish Divergence (orange): The price forms lower highs, but the RSI forms higher highs, indicating trend continuation (selling opportunity in a downtrend). Draw lines and labels at the divergence point as: orange "Hidden▼" See the picture below👇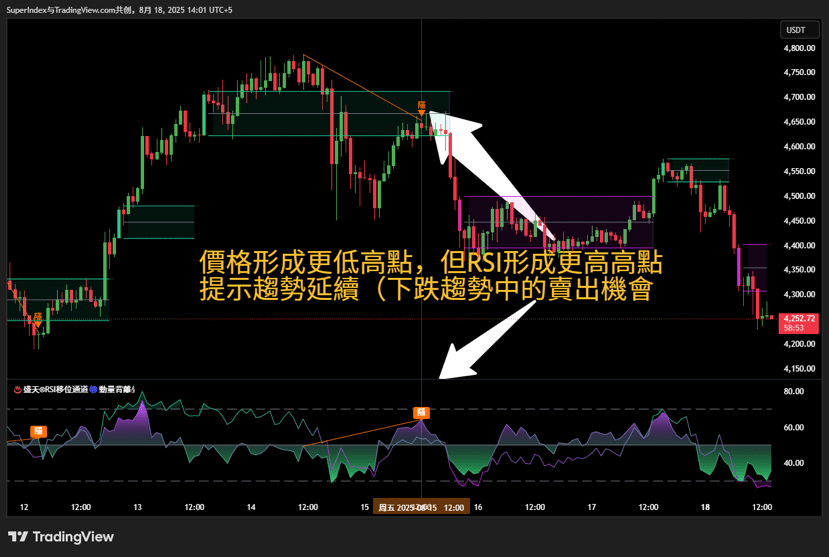
🚨Alert function:
Regular Divergence: Triggers "Bullish Divergence" or "Bearish Divergence" alerts.
Hidden Divergence: Triggers "Hidden Bullish Divergence" or "Hidden Bearish Divergence" alerts.
📊Trading Methods
➤Use bullish divergence zones as potential demand zones and bearish divergence zones as supply zones.
➤Combine RSI pane labels with price level areas to confirm reversal strength.
➤Observe price approaching divergence levels to predict reactions or breakouts.
➤Use divergence levels as trading triggers, stop loss, or profit taking marks.
High probability trading:
🔴 More reliable when RSI shift zones and divergence signals occur simultaneously. Oversold channel + bullish divergence = strong buy signal. See the picture below 👇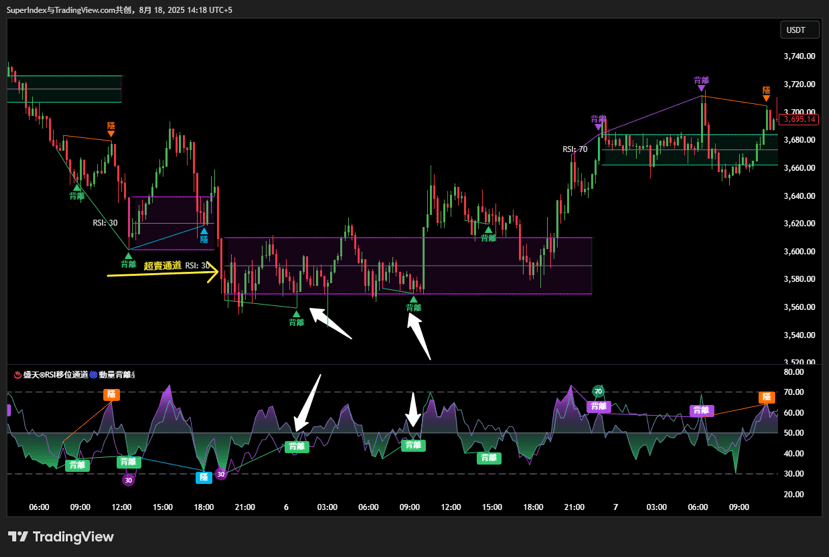
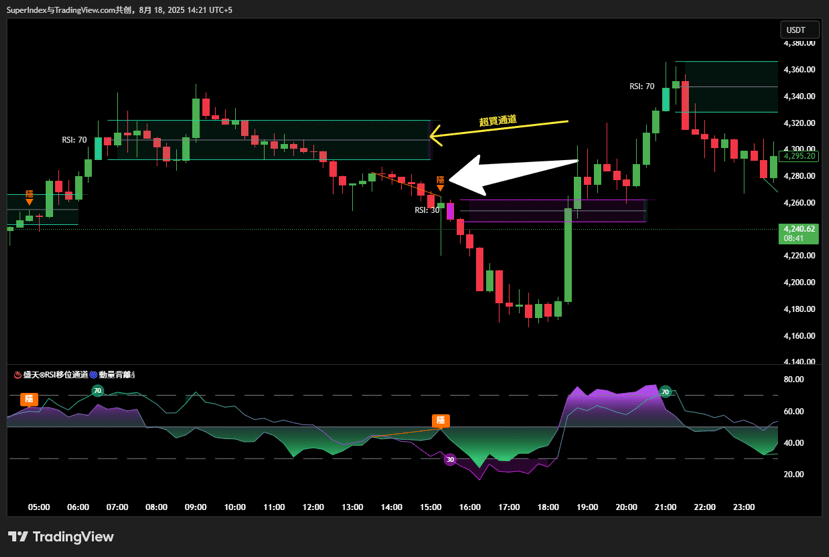 🔴 Use the RSI shift zone in the overbought/oversold channel to find support/resistance. See the picture below👇
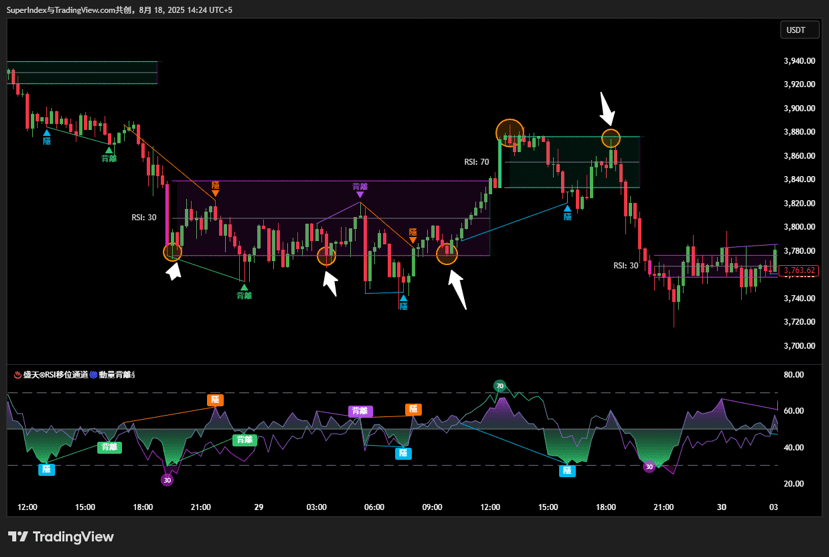
Use regular divergence to capture reversals, and hidden divergence to confirm trend continuation.
Combine multiple signals (channel + divergence) to increase win rate, and set stop loss and take profit.
💯Notes
Market applicability: In oscillating markets, RSI shift zones are more effective; in strong trending markets, hidden divergence is more suitable for capturing trend-following opportunities.
Avoid using it alone: Divergence signals may produce false signals, it is recommended to combine with trend indicators or price patterns for confirmation. See the picture below👇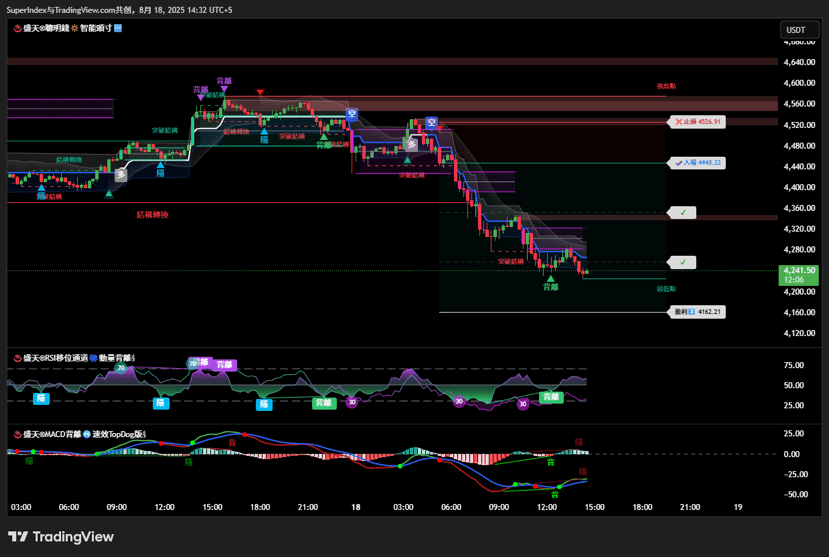
Combine with other indicators (such as moving averages, volume) or K-line patterns to confirm signals, and set stop loss (such as below the lower rail of the channel) to control risk. See the picture below👇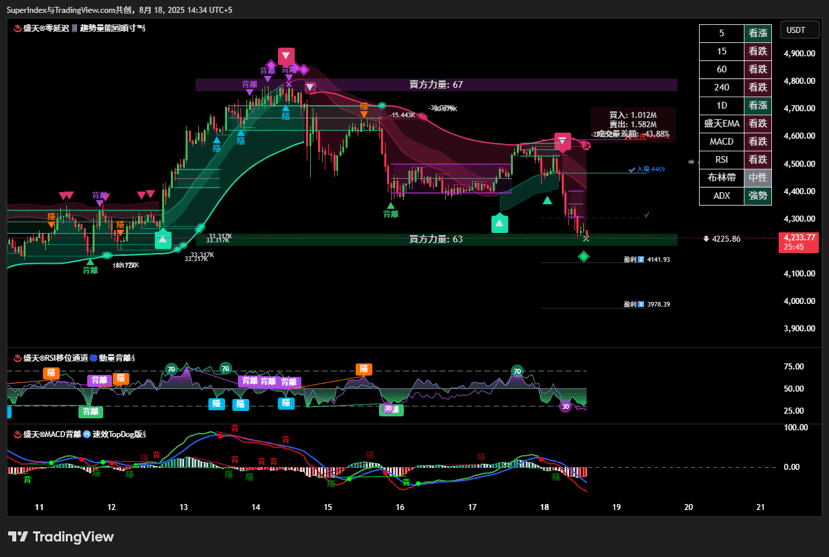
Author's notes
👨🌾 The RSI Shift Zone and Momentum Divergence indicator provides dynamic support/resistance references through the RSI shift zone, and identifies reversal and continuation opportunities through regular and hidden divergences. The alert function (global scope) allows instant monitoring of overbought/oversold, regular divergence and hidden divergence signals. Trading advice: Combine multiple signals (channel + divergence) to increase the win rate, and set stop loss and take profit. If you have any other questions, please feel free to let me know, I will provide more technical sharing support! ❤#技术分析参考 #RSI #币安HODLer空投PLUME #技术分析教学 #干货 $ETH