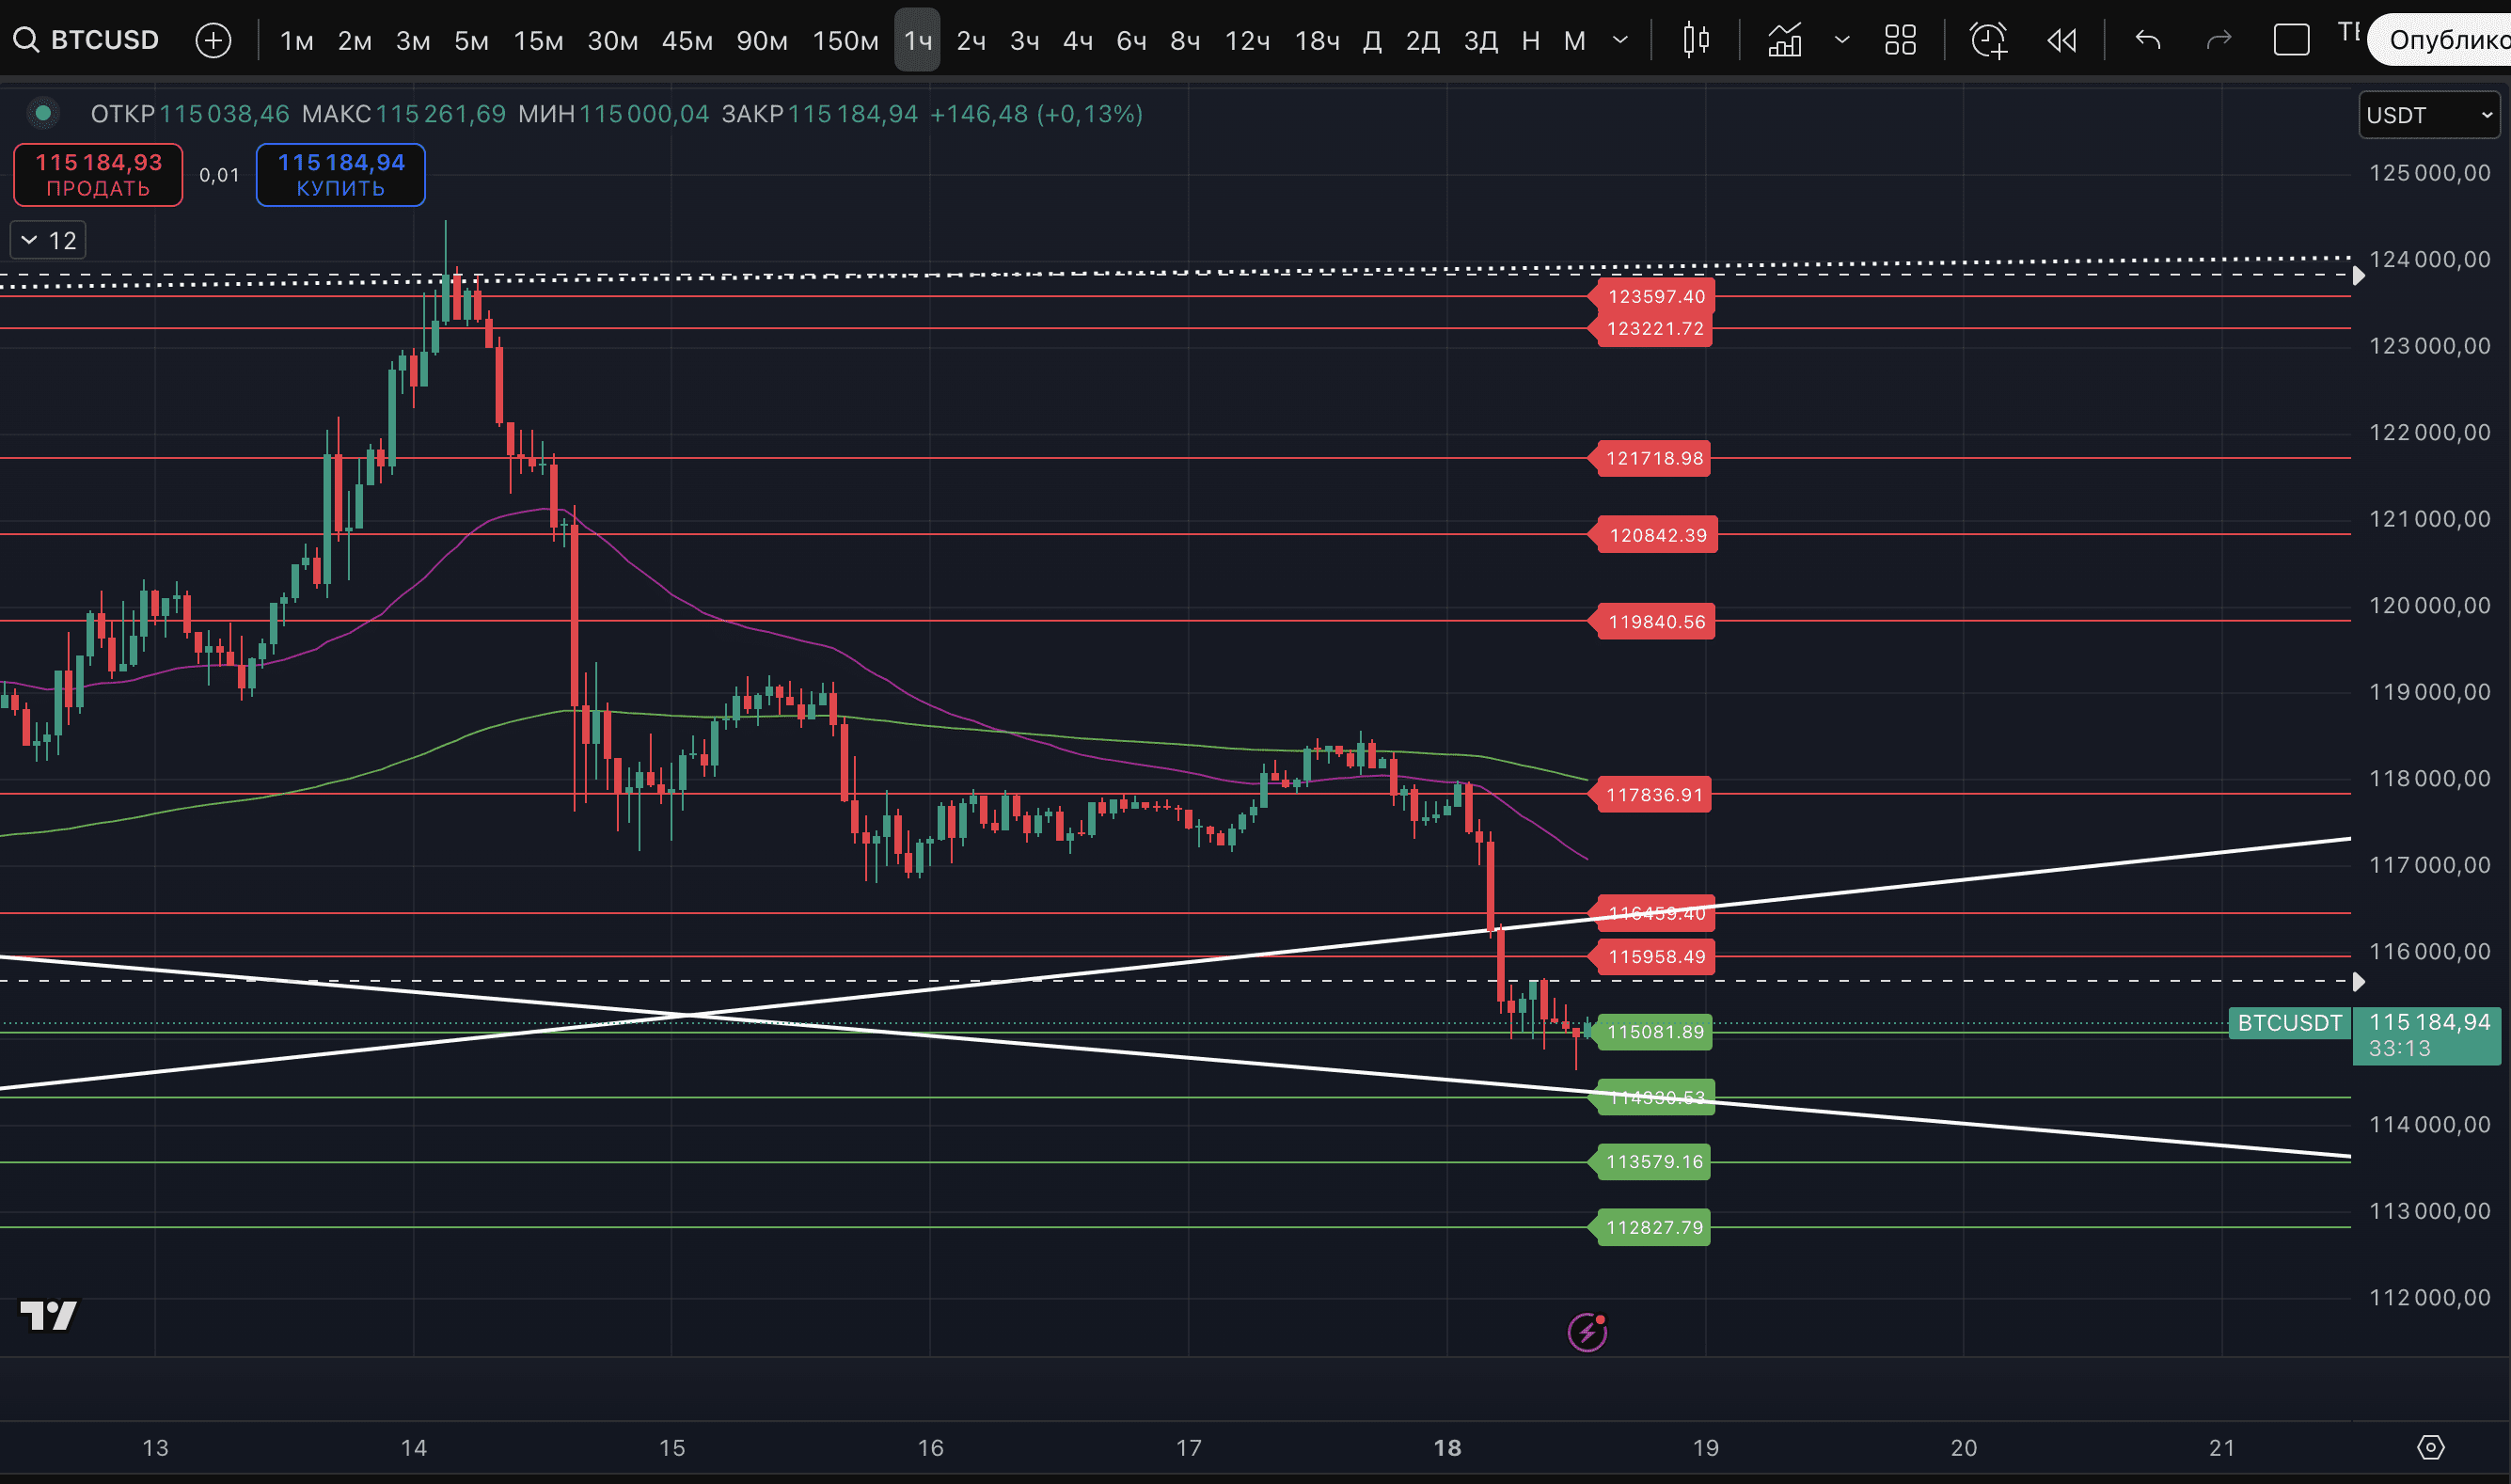
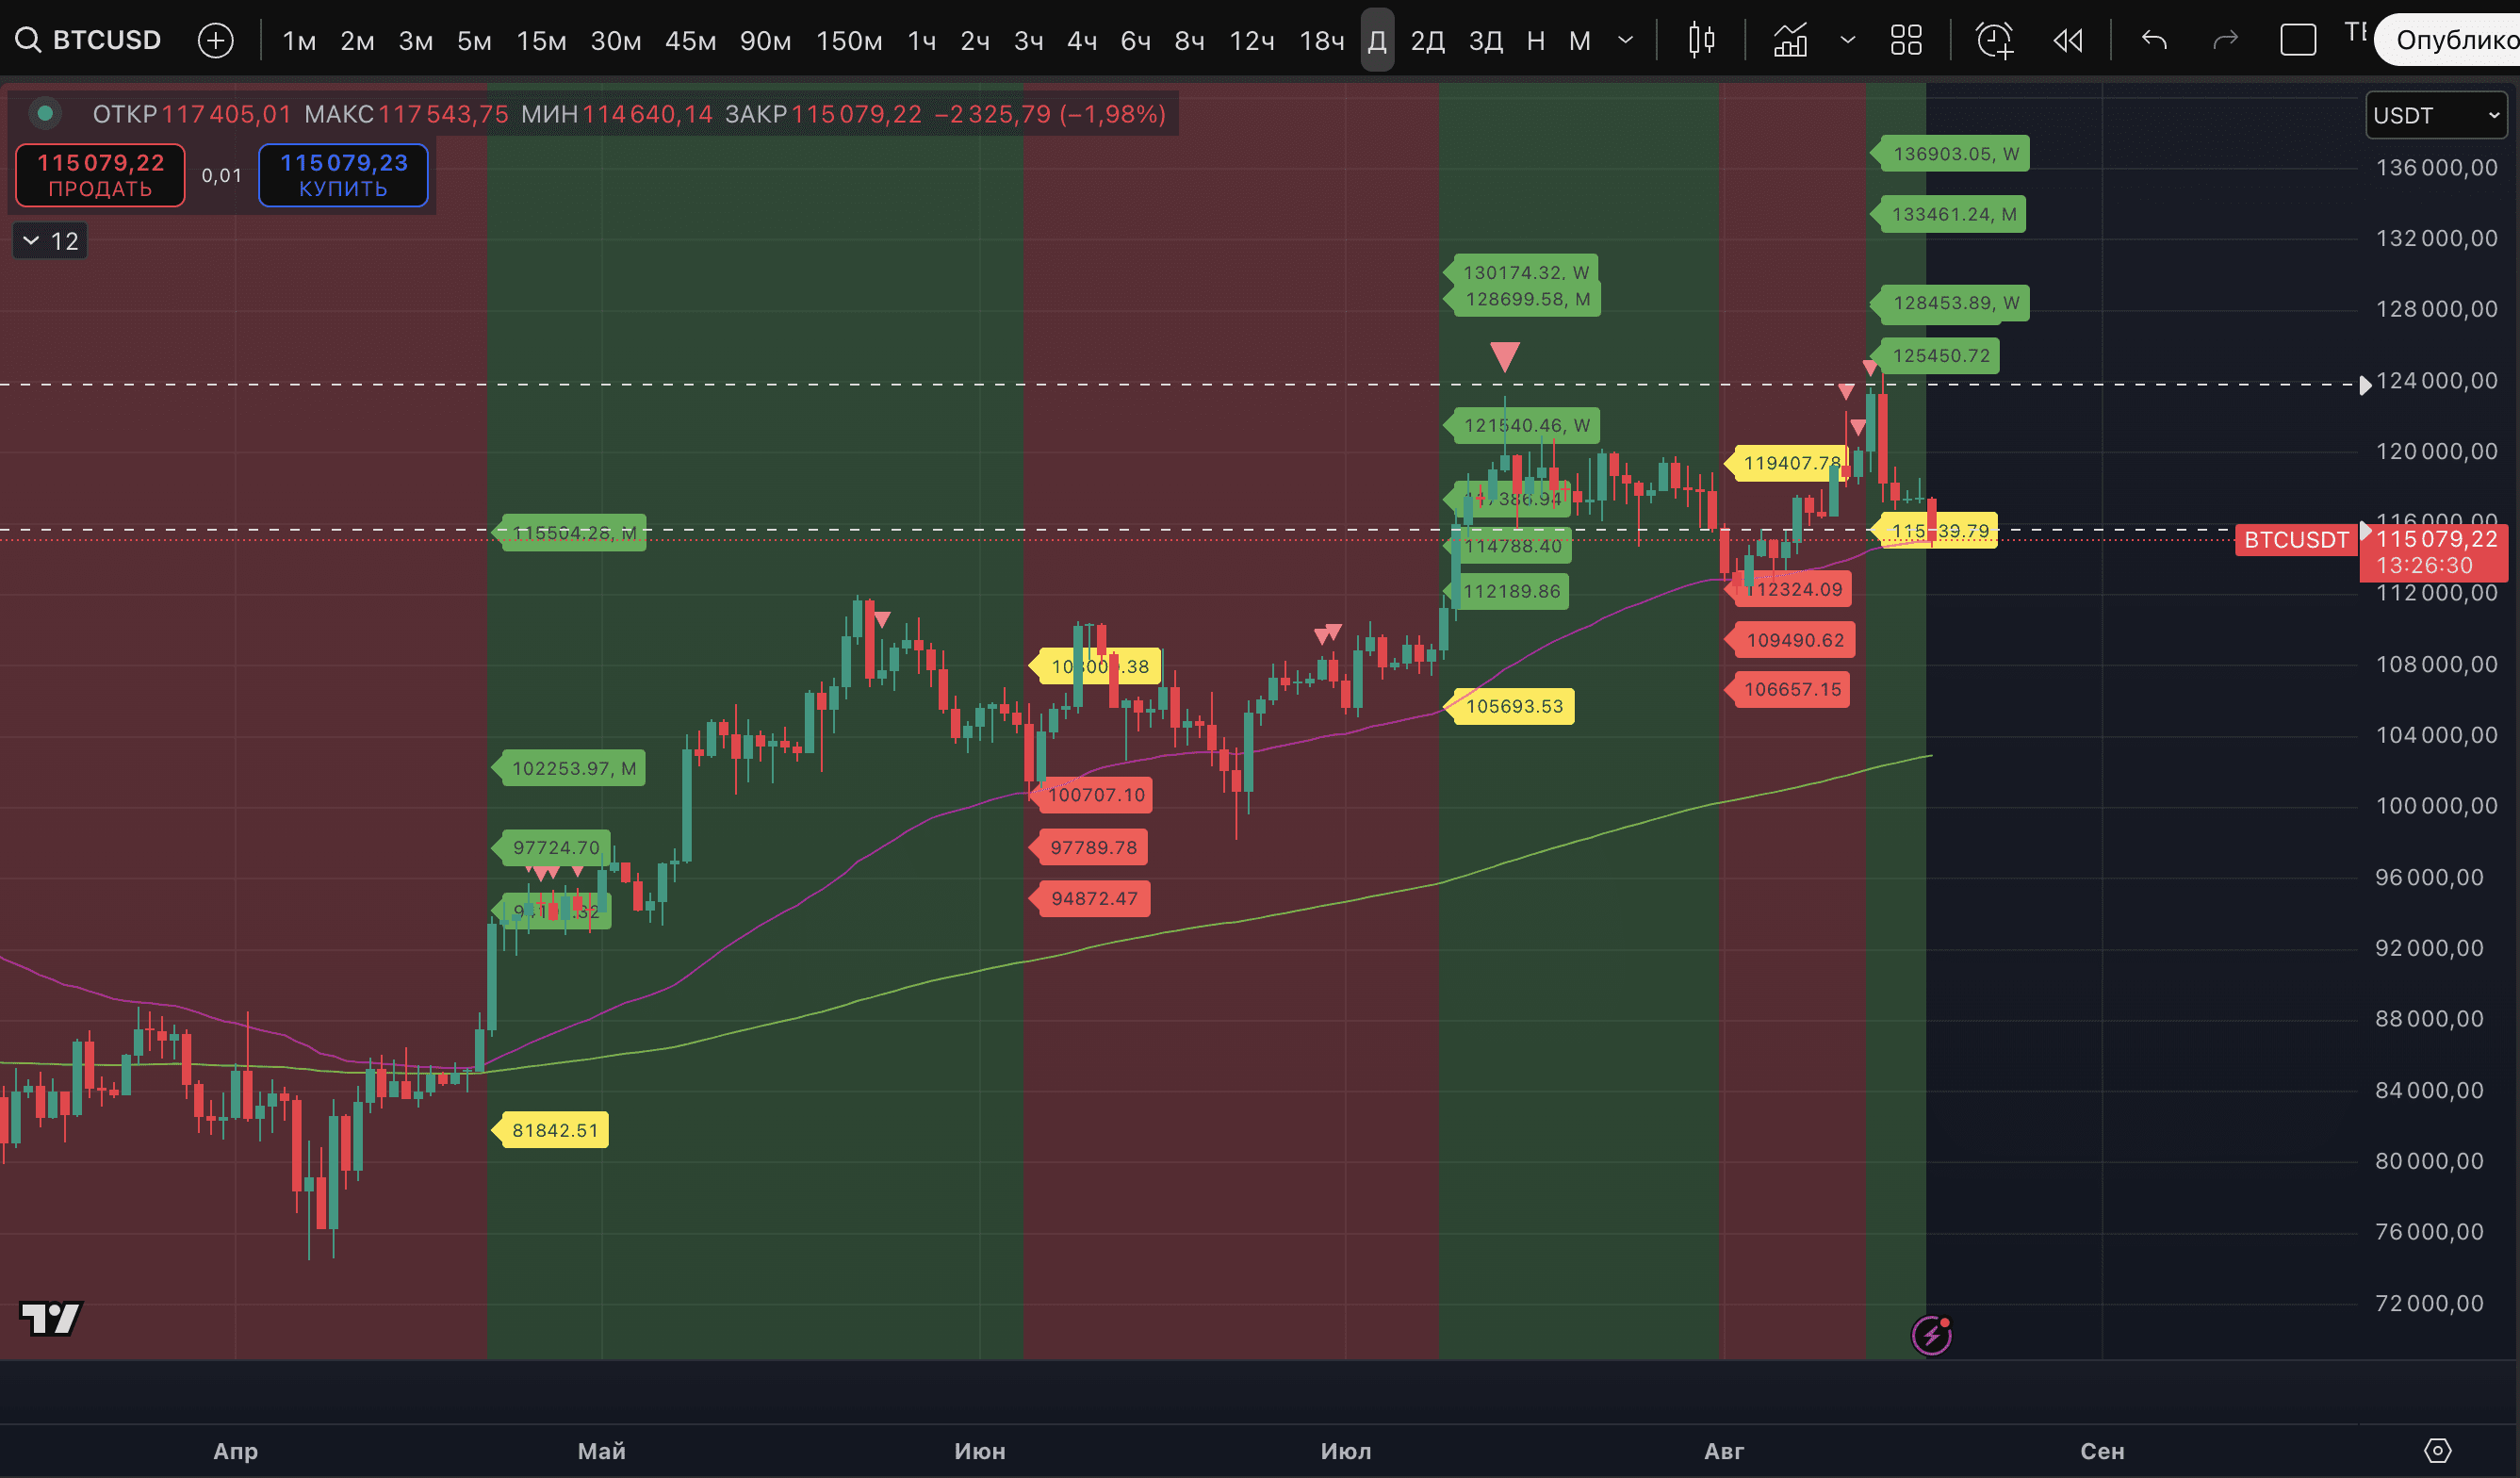
BTC started the week with aggressive depreciation, testing the psychological level of $115,000. The current low is $114,640.
The closed trade this morning yielded a relatively modest profit of around +50%, details:
- #Binance: short with 30 leverage from the level of $117,482.90, closed at $115,468.20.
- Exchange #1: short with 30 leverage from the level of $117,447.20, potential liquidation level $115,450.00.
- Exchange #2: short with 125 leverage and additional liquidity from the level of $117,476.30, potential liquidation level $115,439.2.
The trade itself did not allow for a large movement and rather neutralized the loss of the previous long with a short stop. It was taken on the night from Saturday to Sunday around $117,400 with hints of continued correction, but in fact, the price went higher from our entry level to $118,575. In case of a full rebound, we had orders to add to the short position at $119,840 and $121,718. But as can be seen - the scenario has been invalidated.
Today, the decline continued, and there are now several very important signals from our indicator:
1. Three Strong signal markers of a potential low on the hourly timeframe.
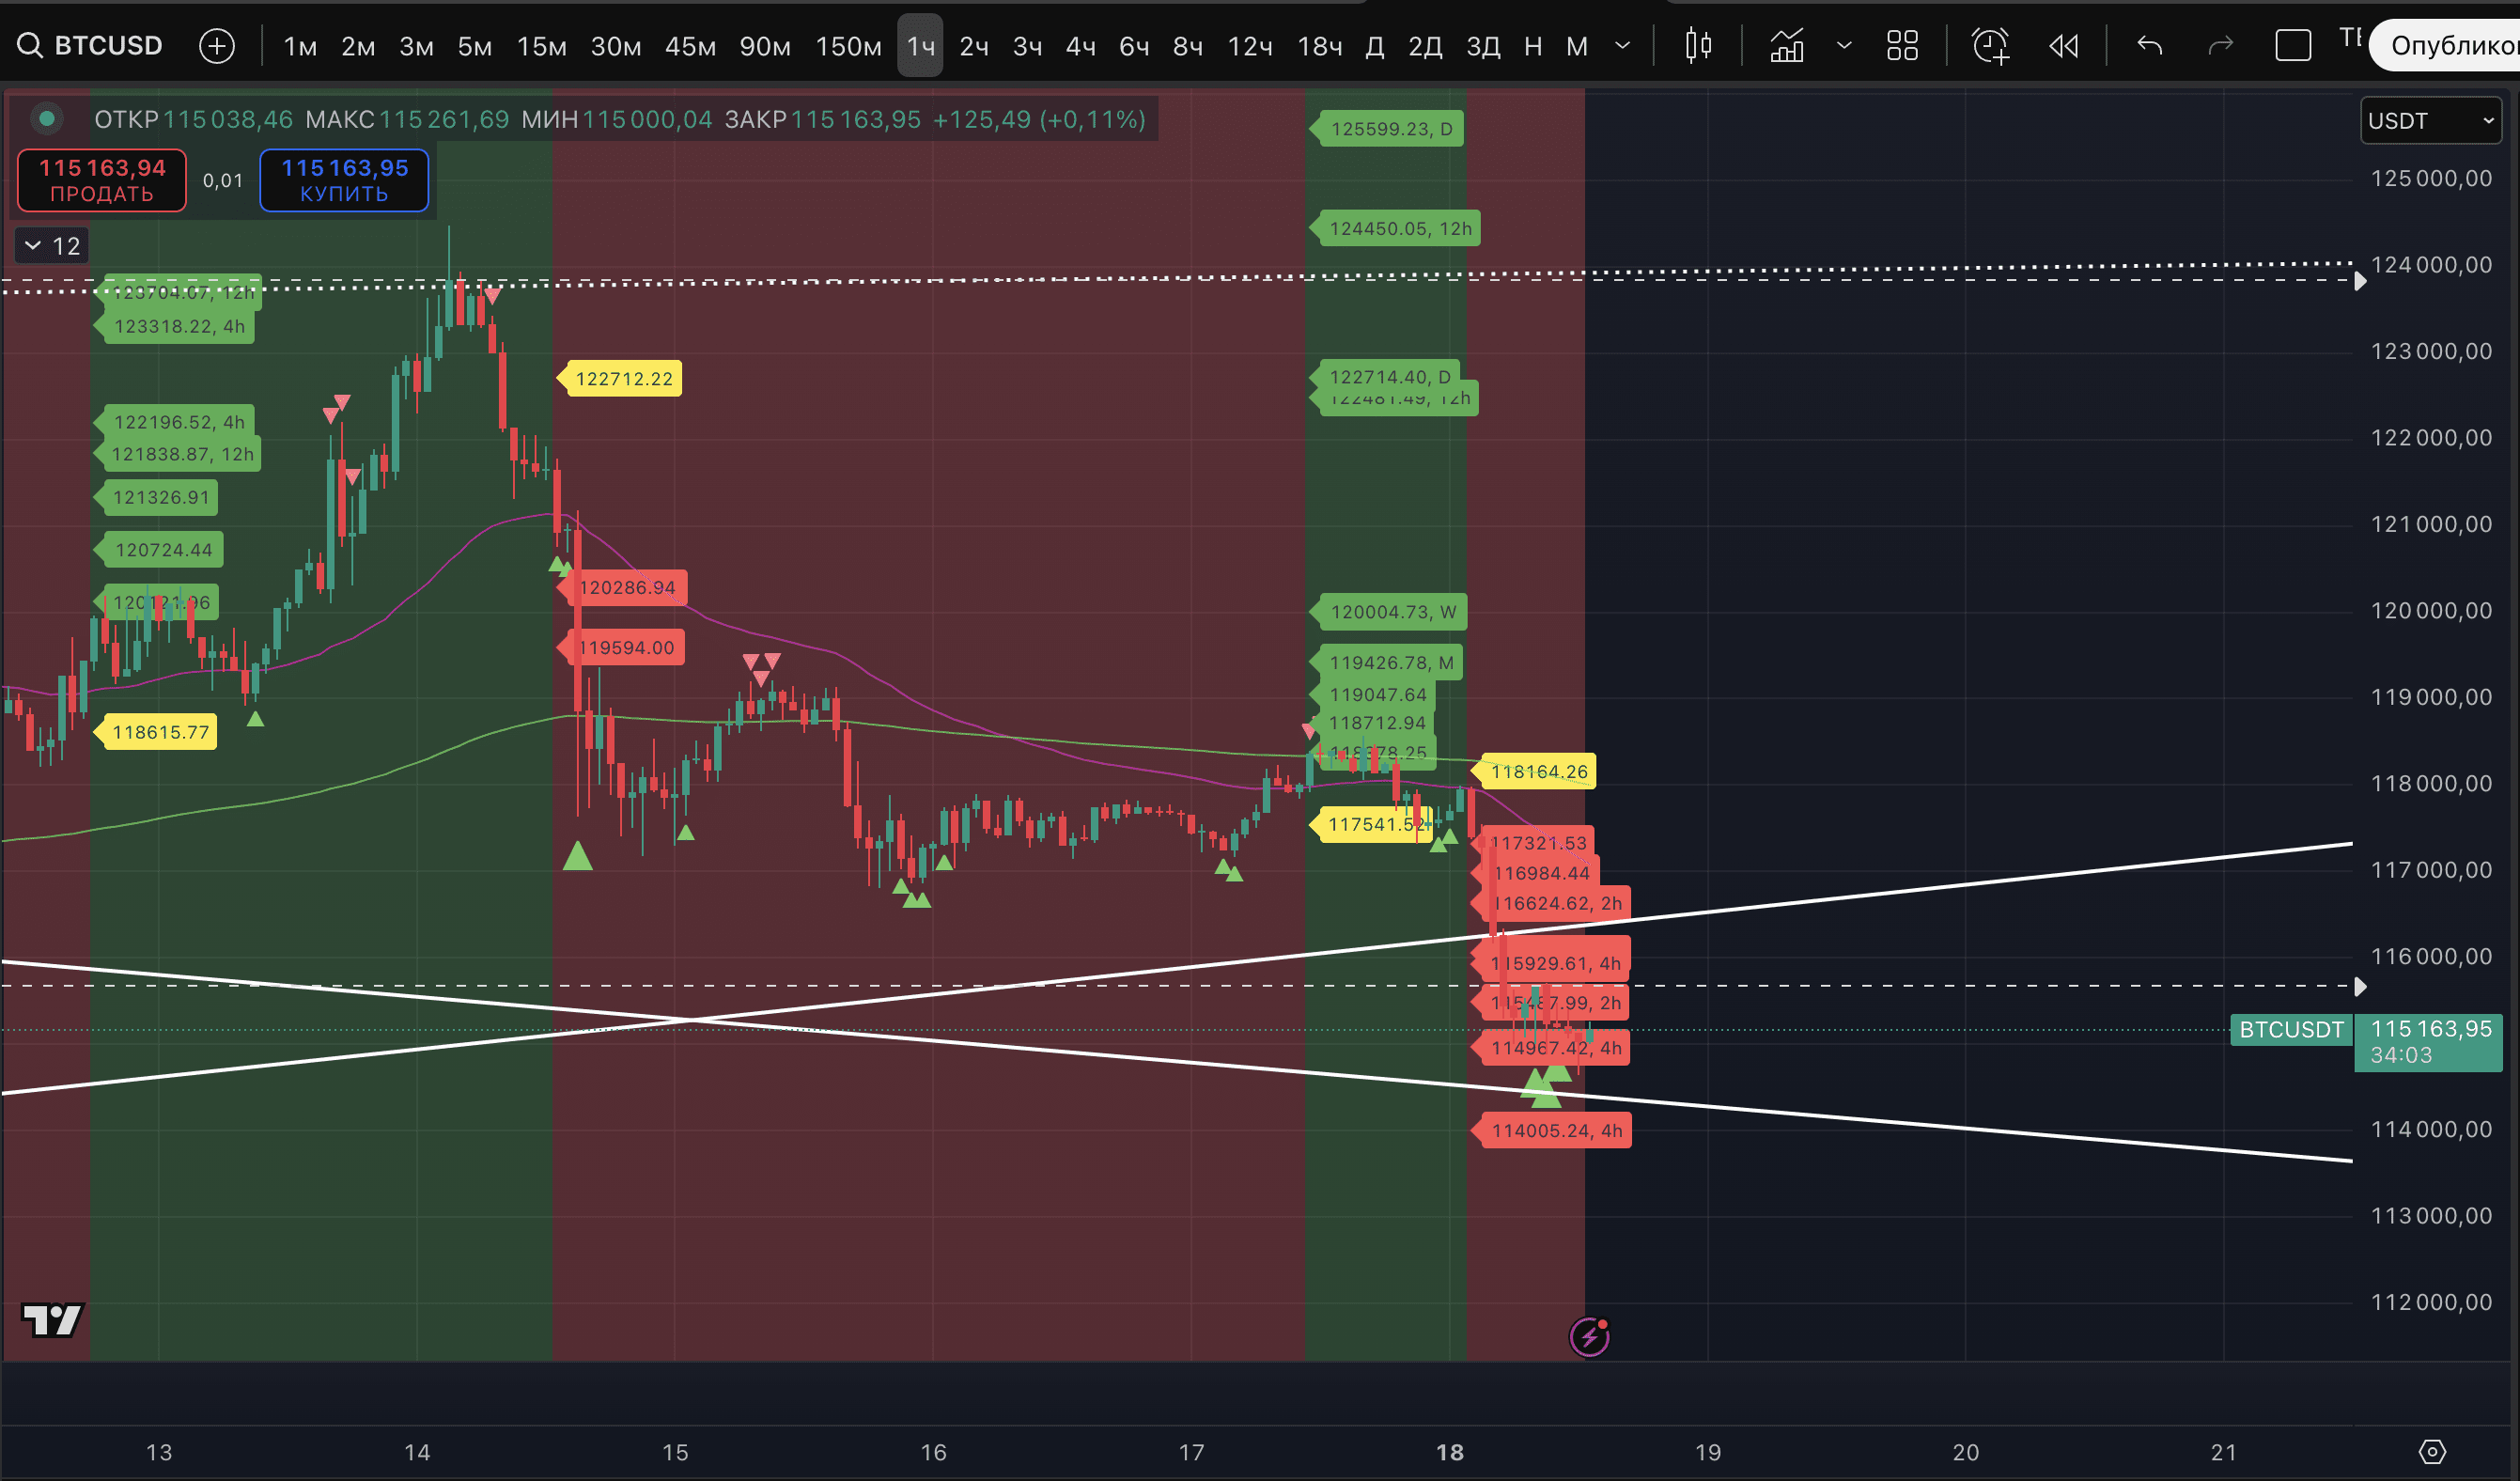
2. Three regular markers of a potential low on the 2-hour timeframe.
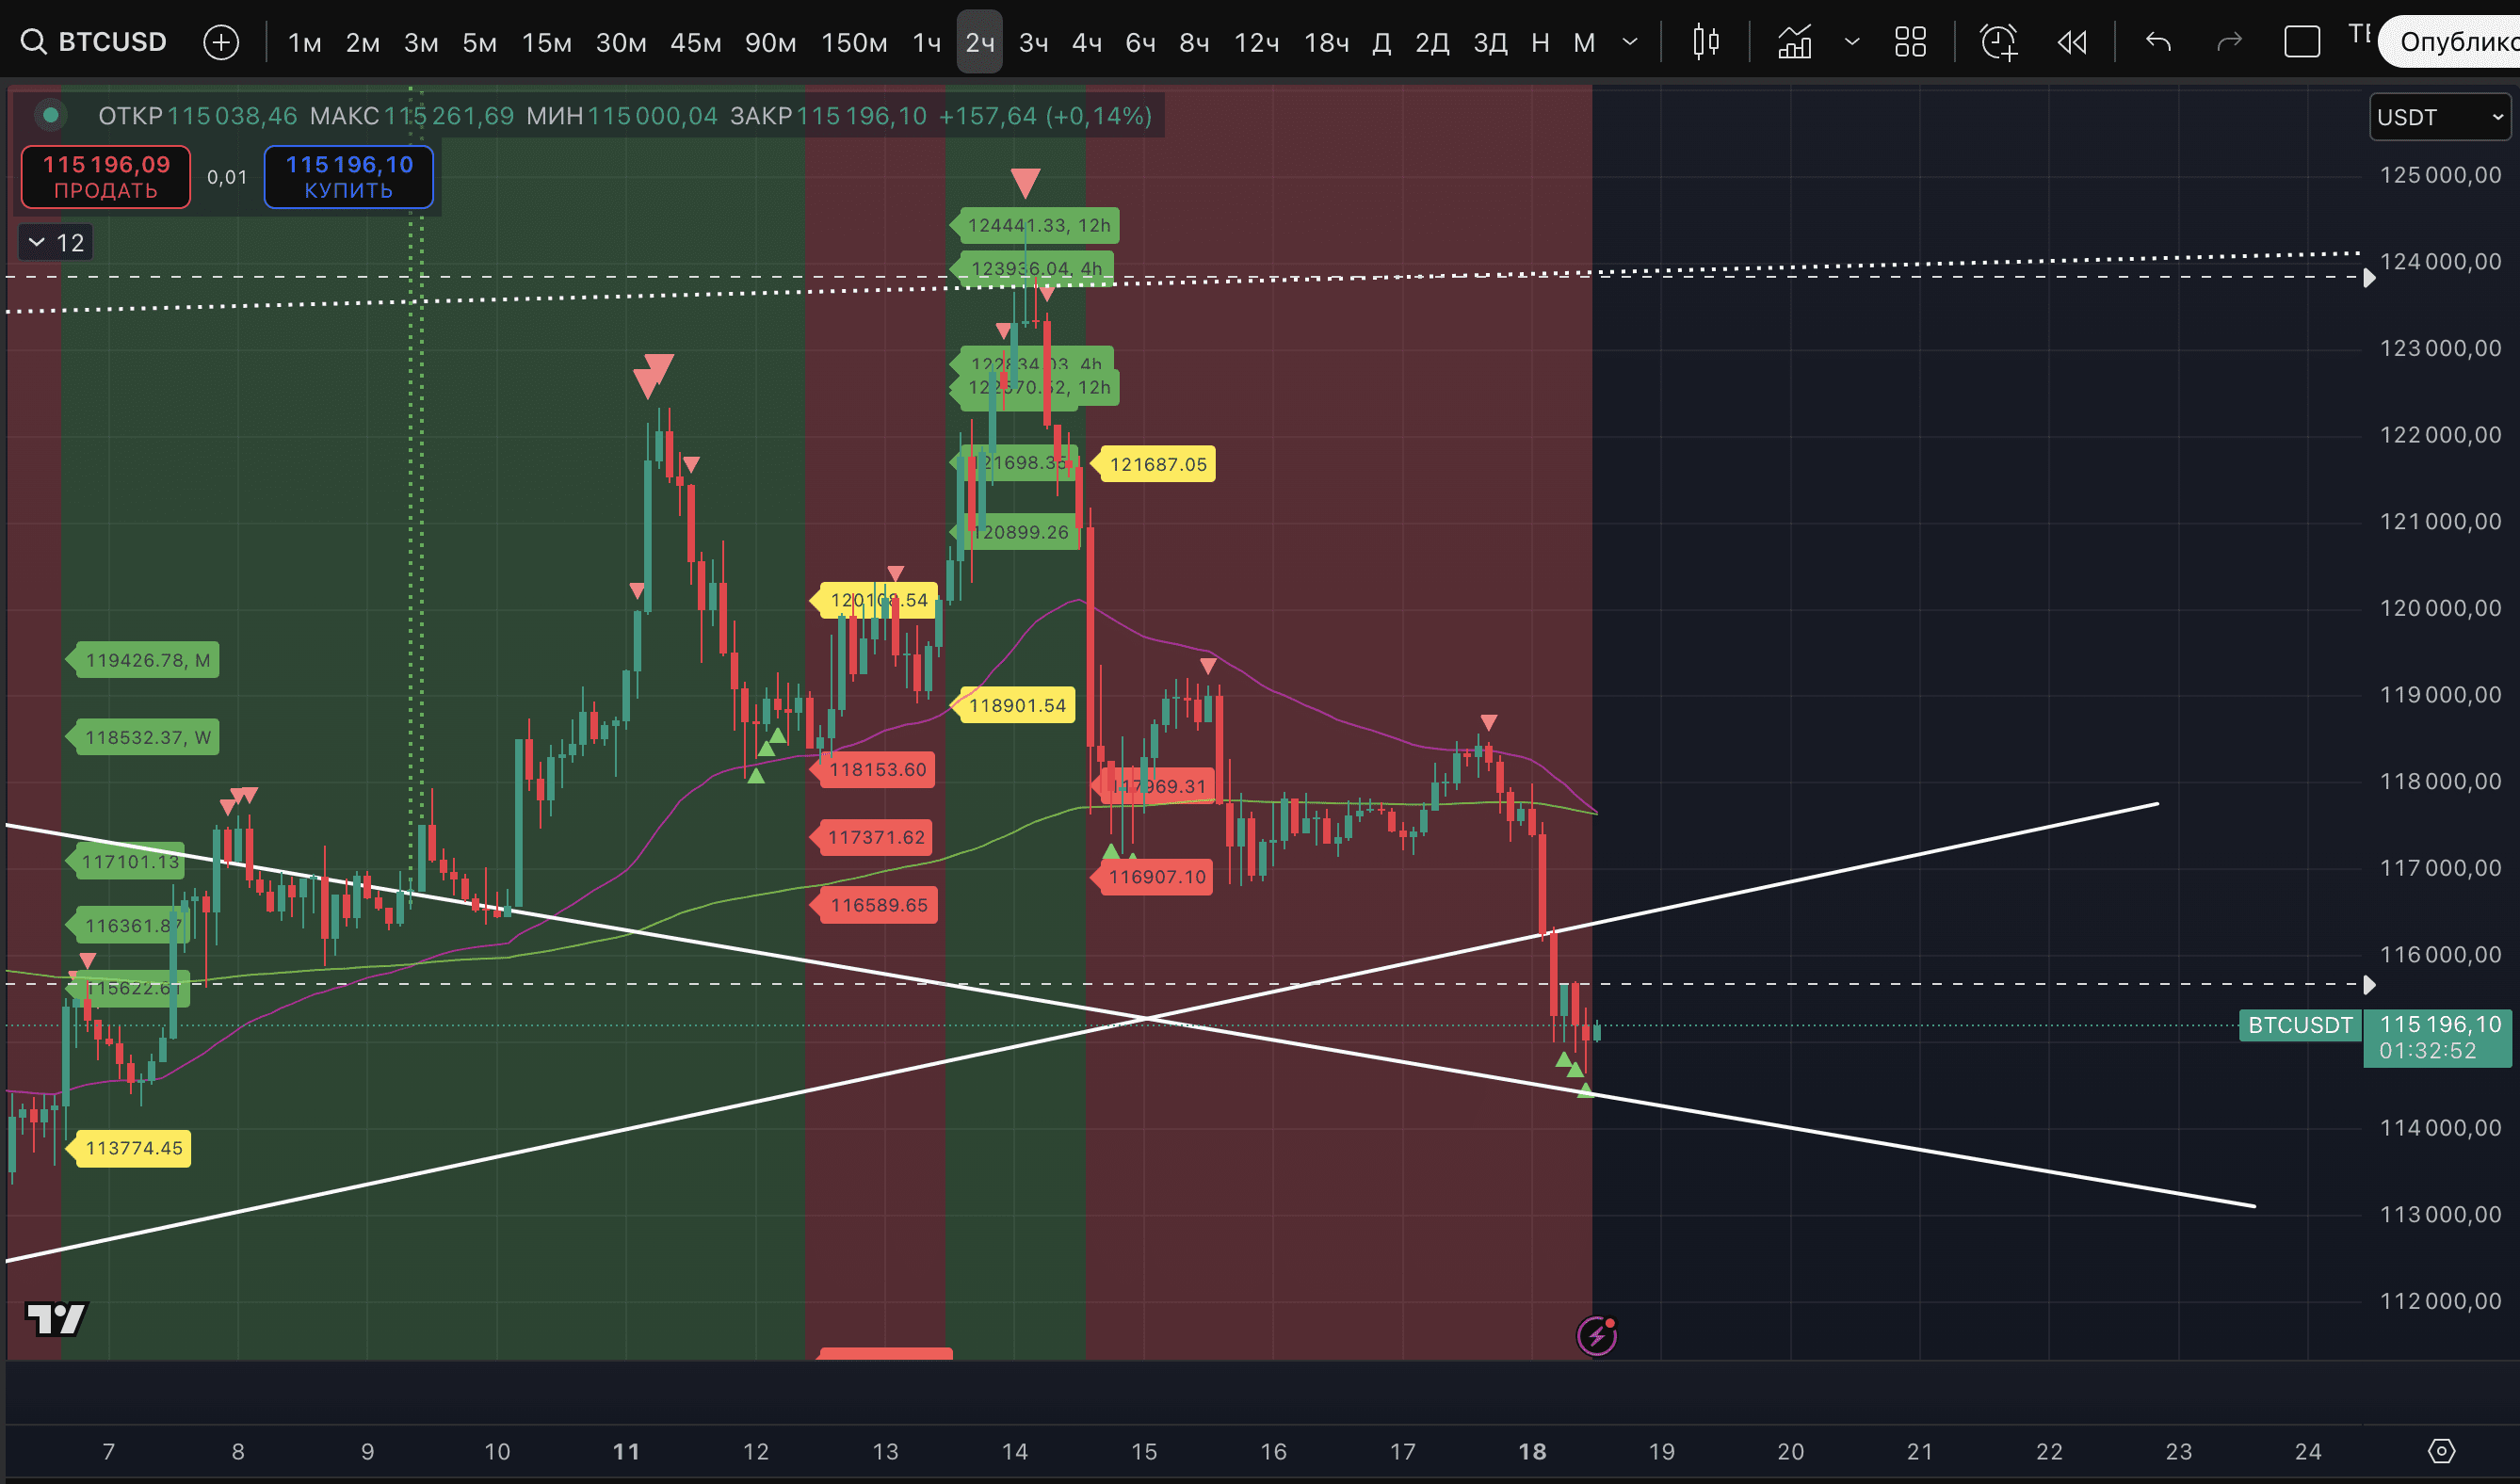
3. One regular marker of a potential low on the 3-hour timeframe.
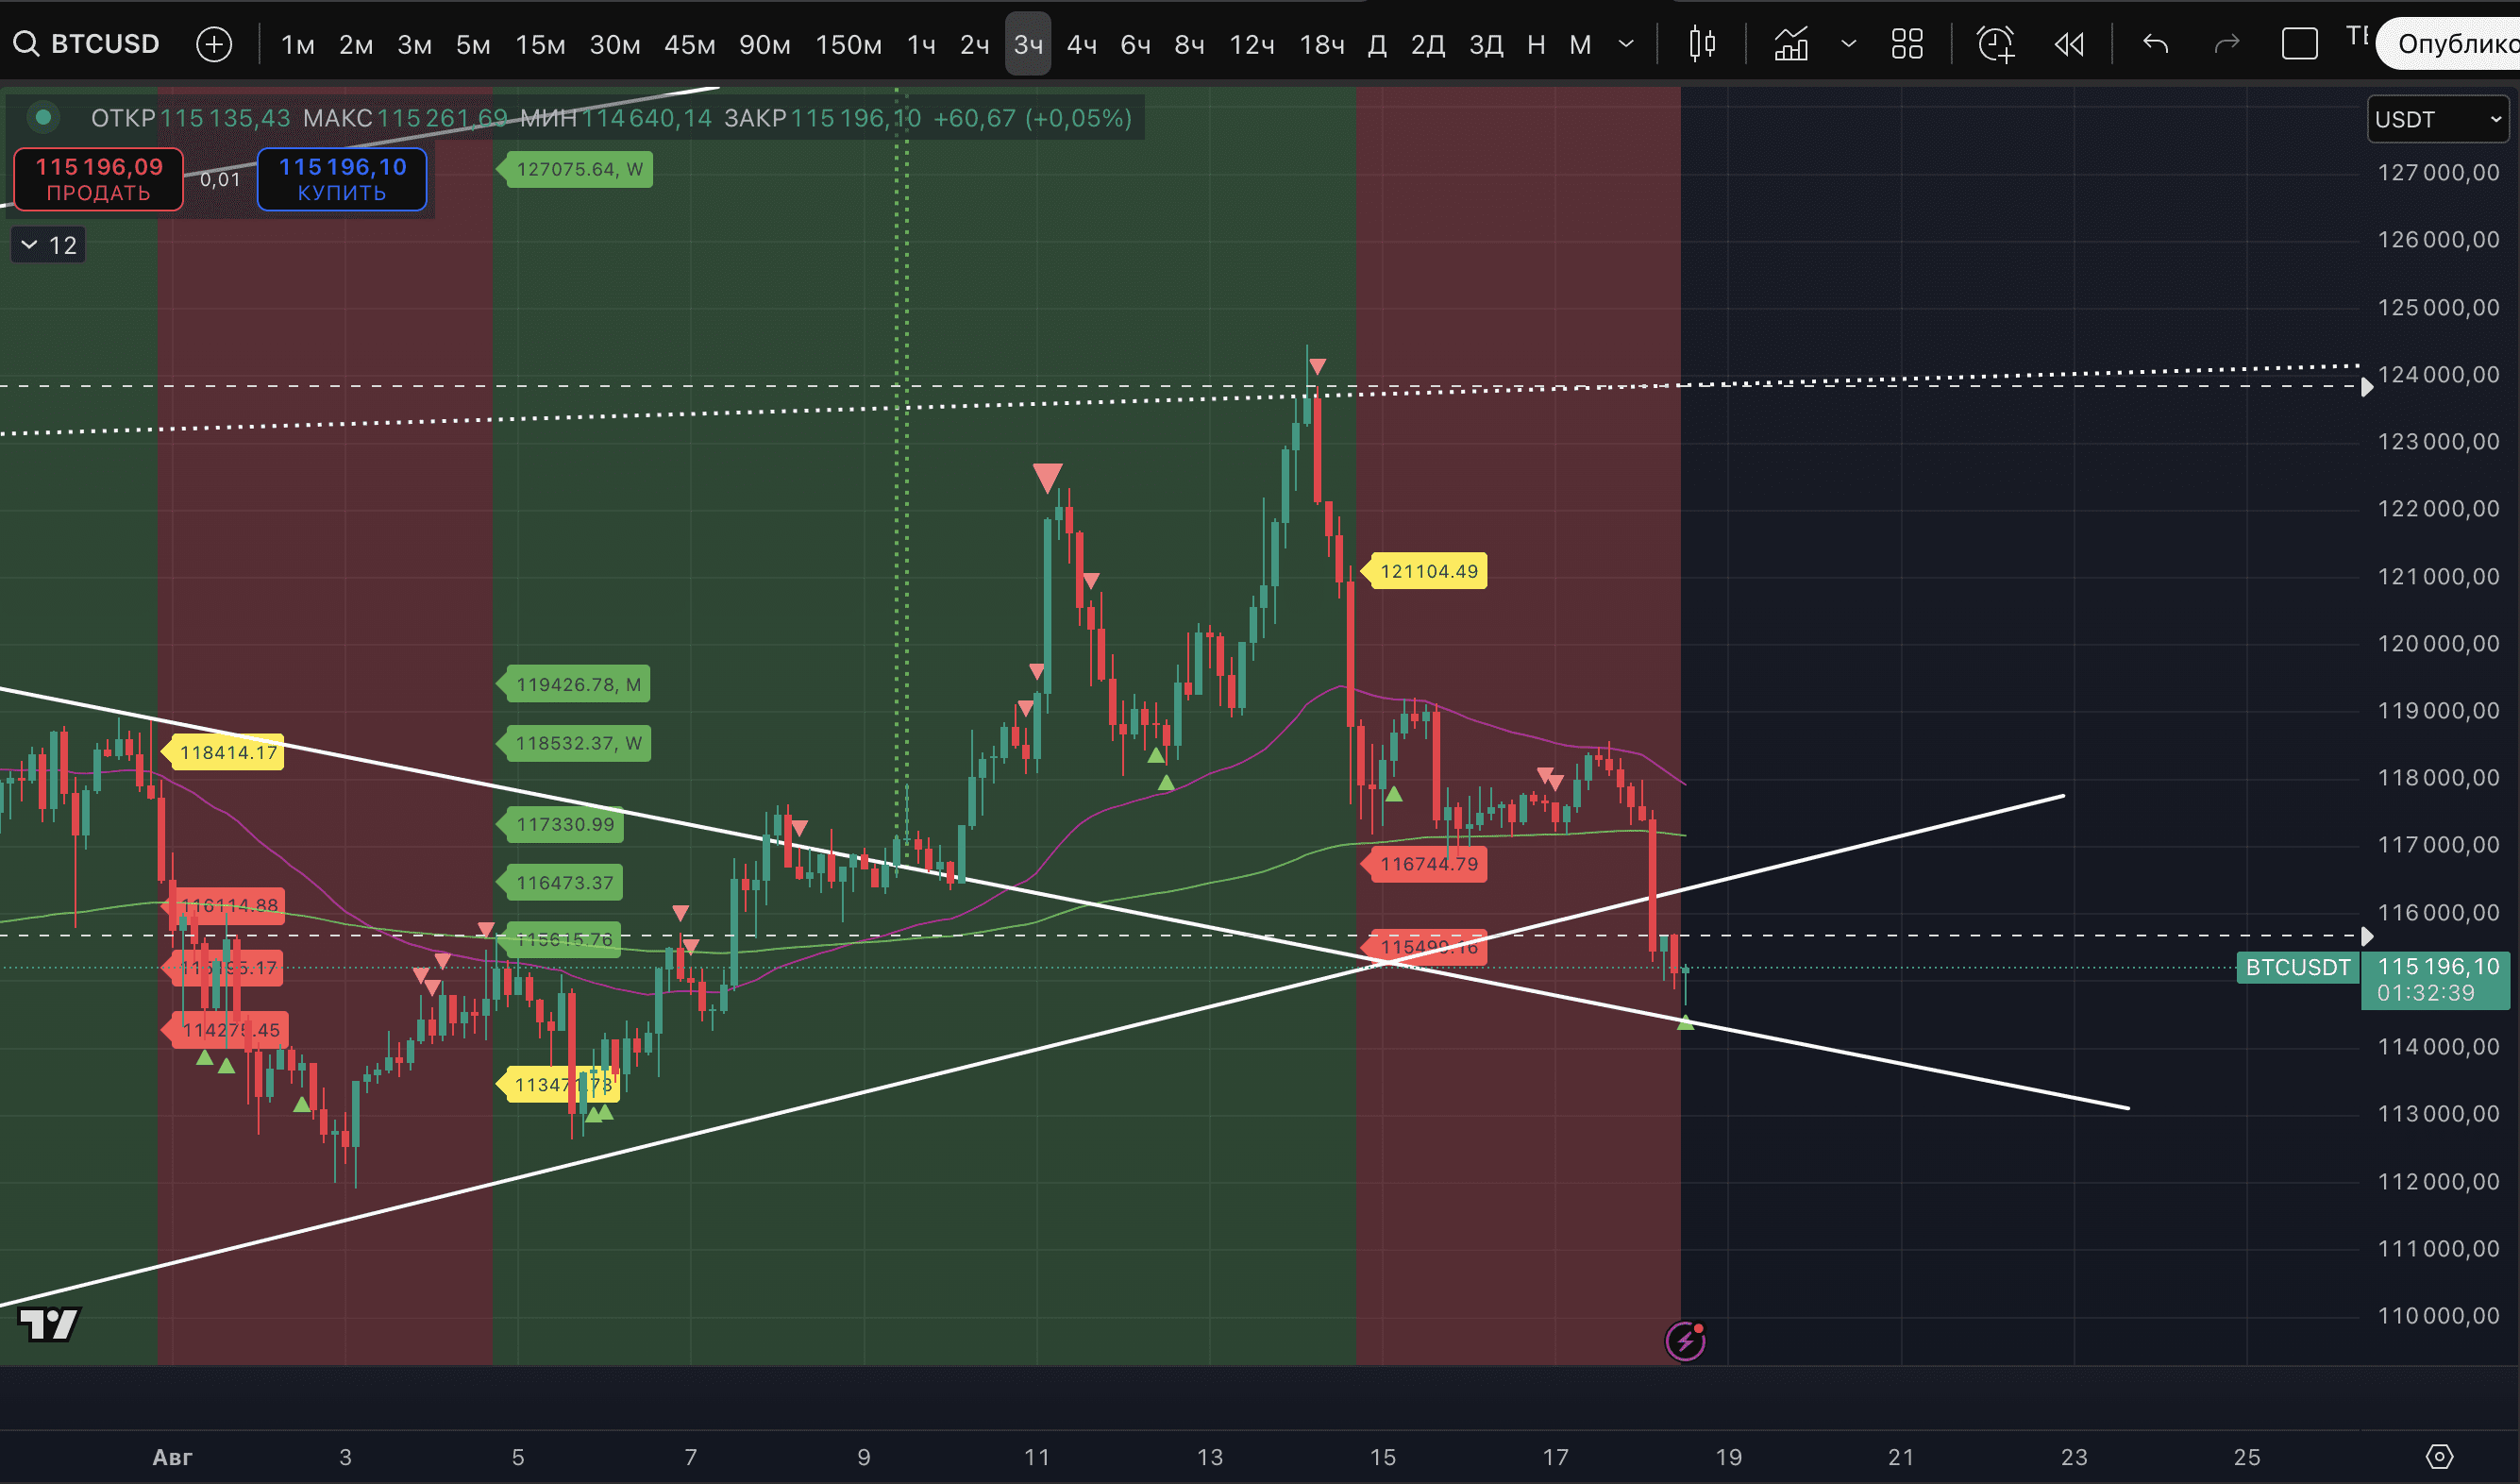
4. The price has already achieved targets for declines in downtrends on the 3- and 4-hour timeframes (the extreme was at $114,687).
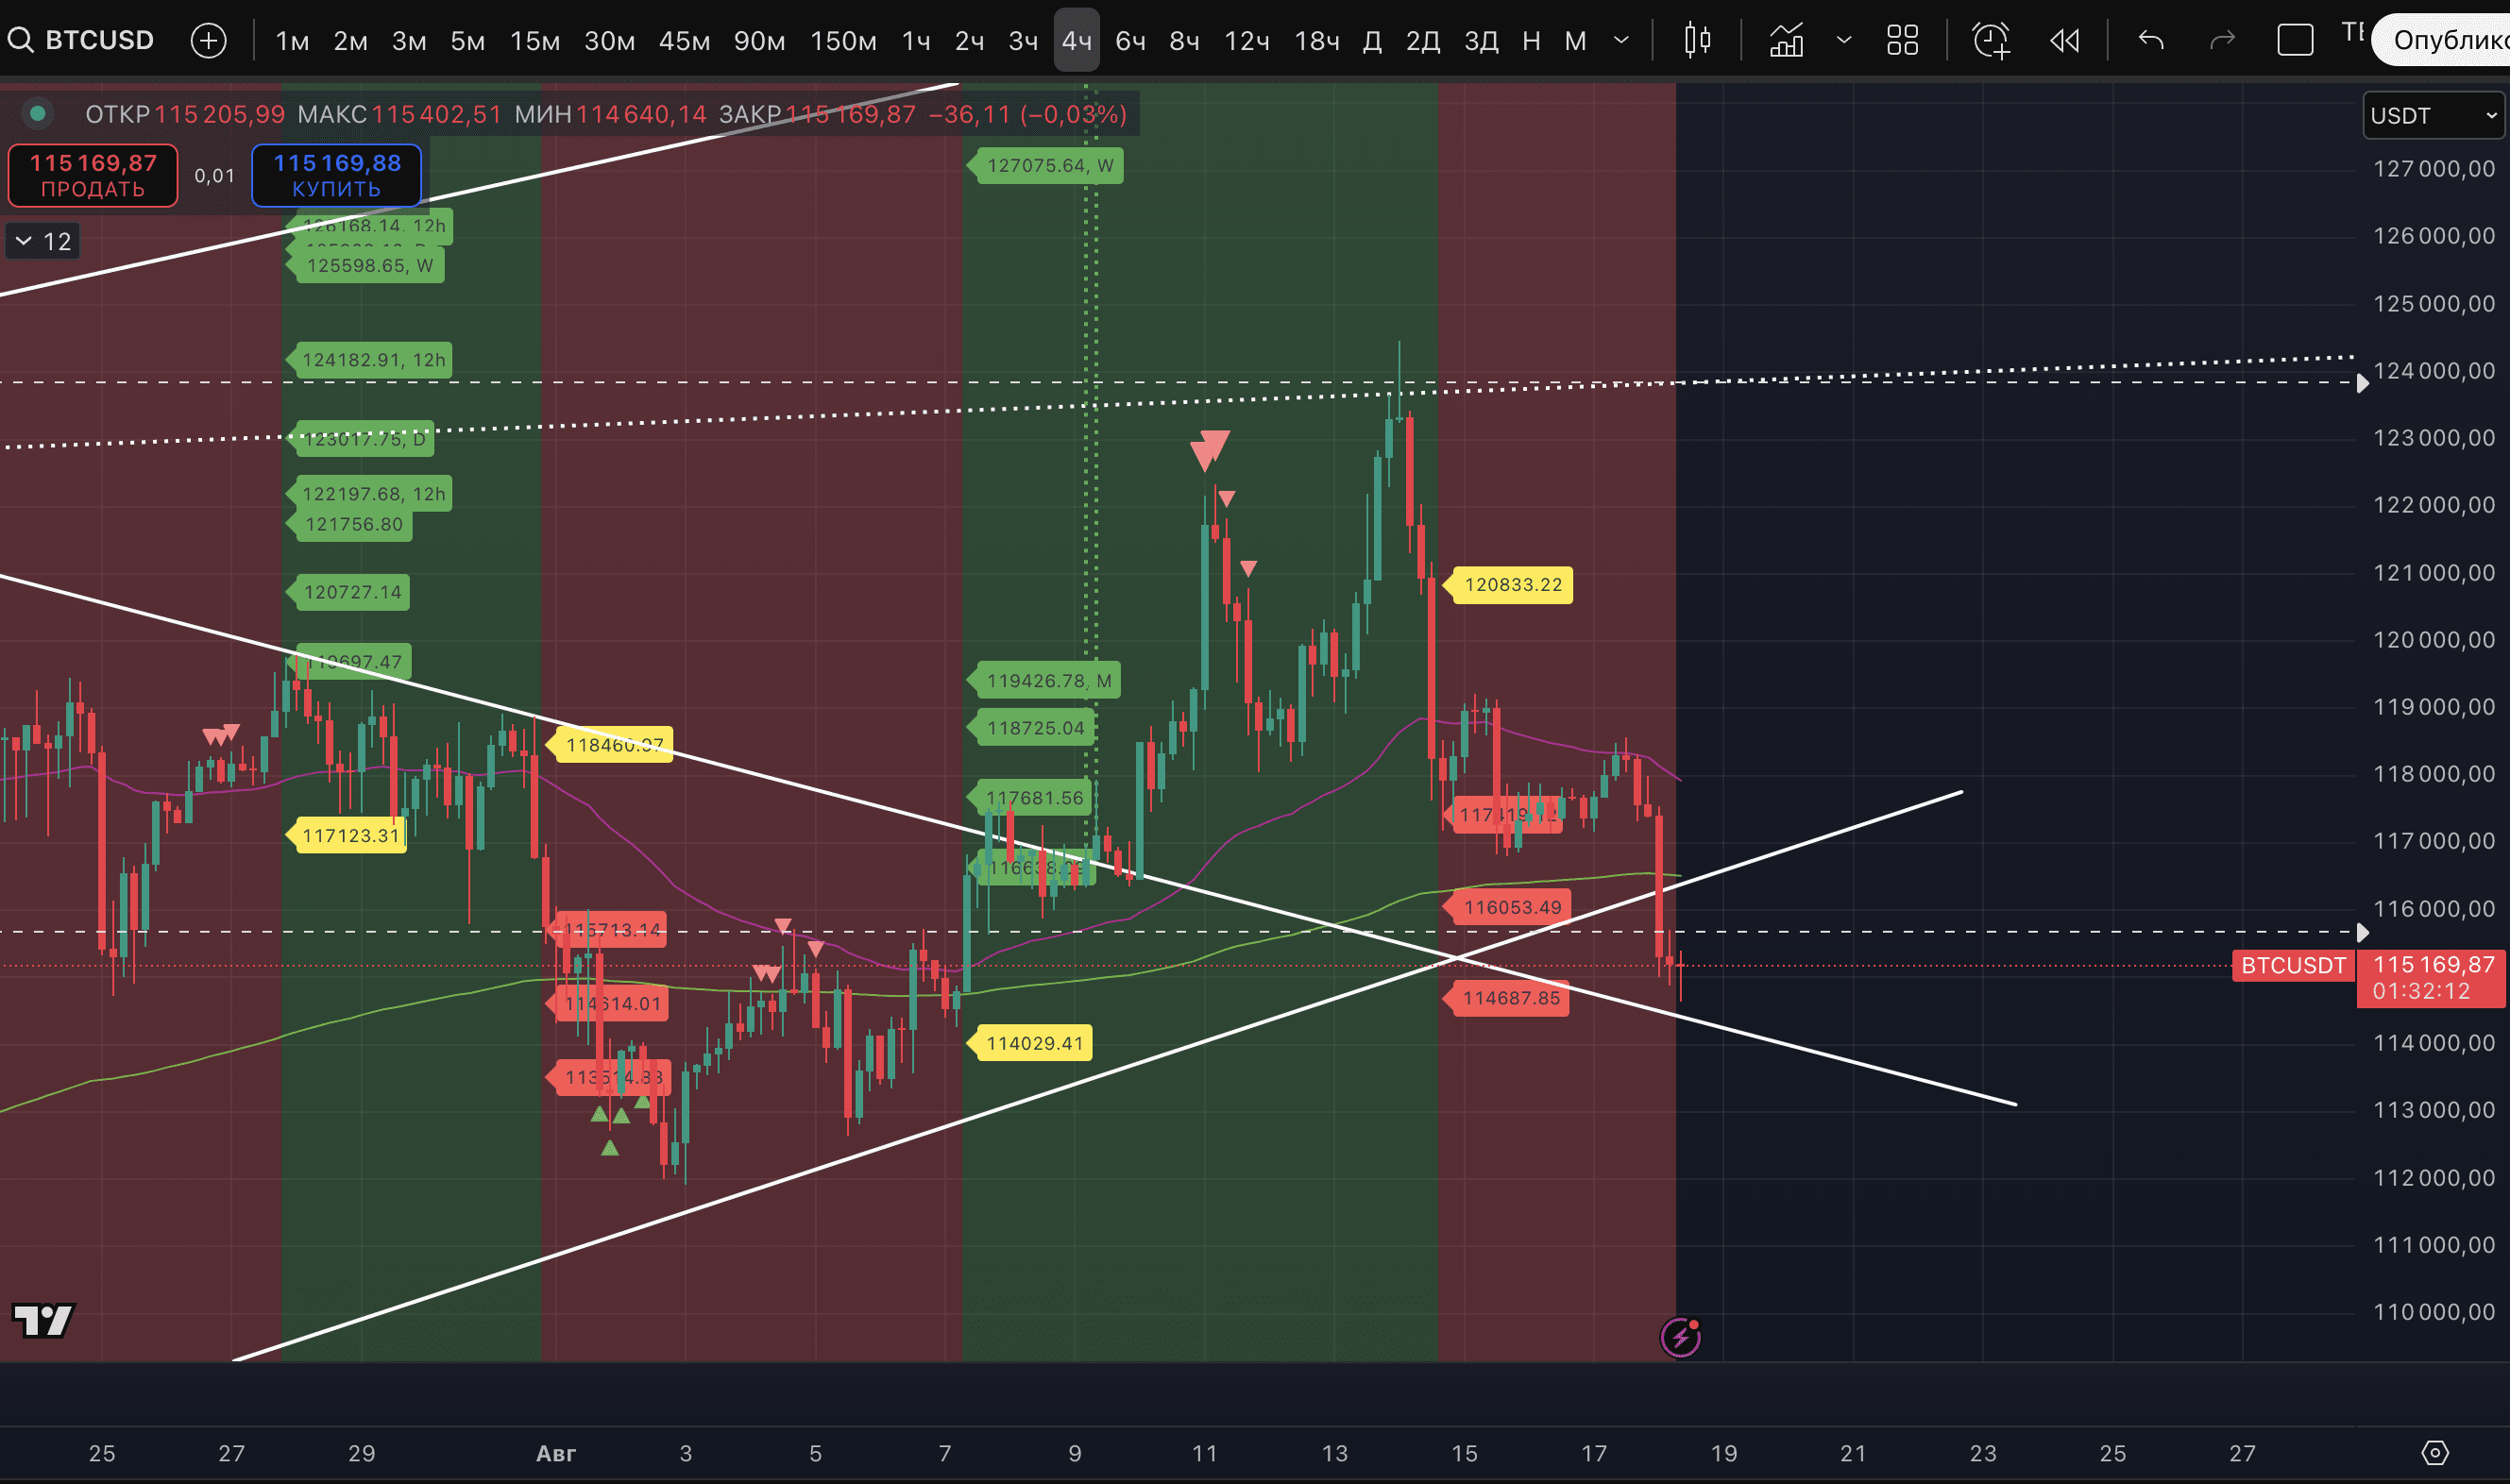
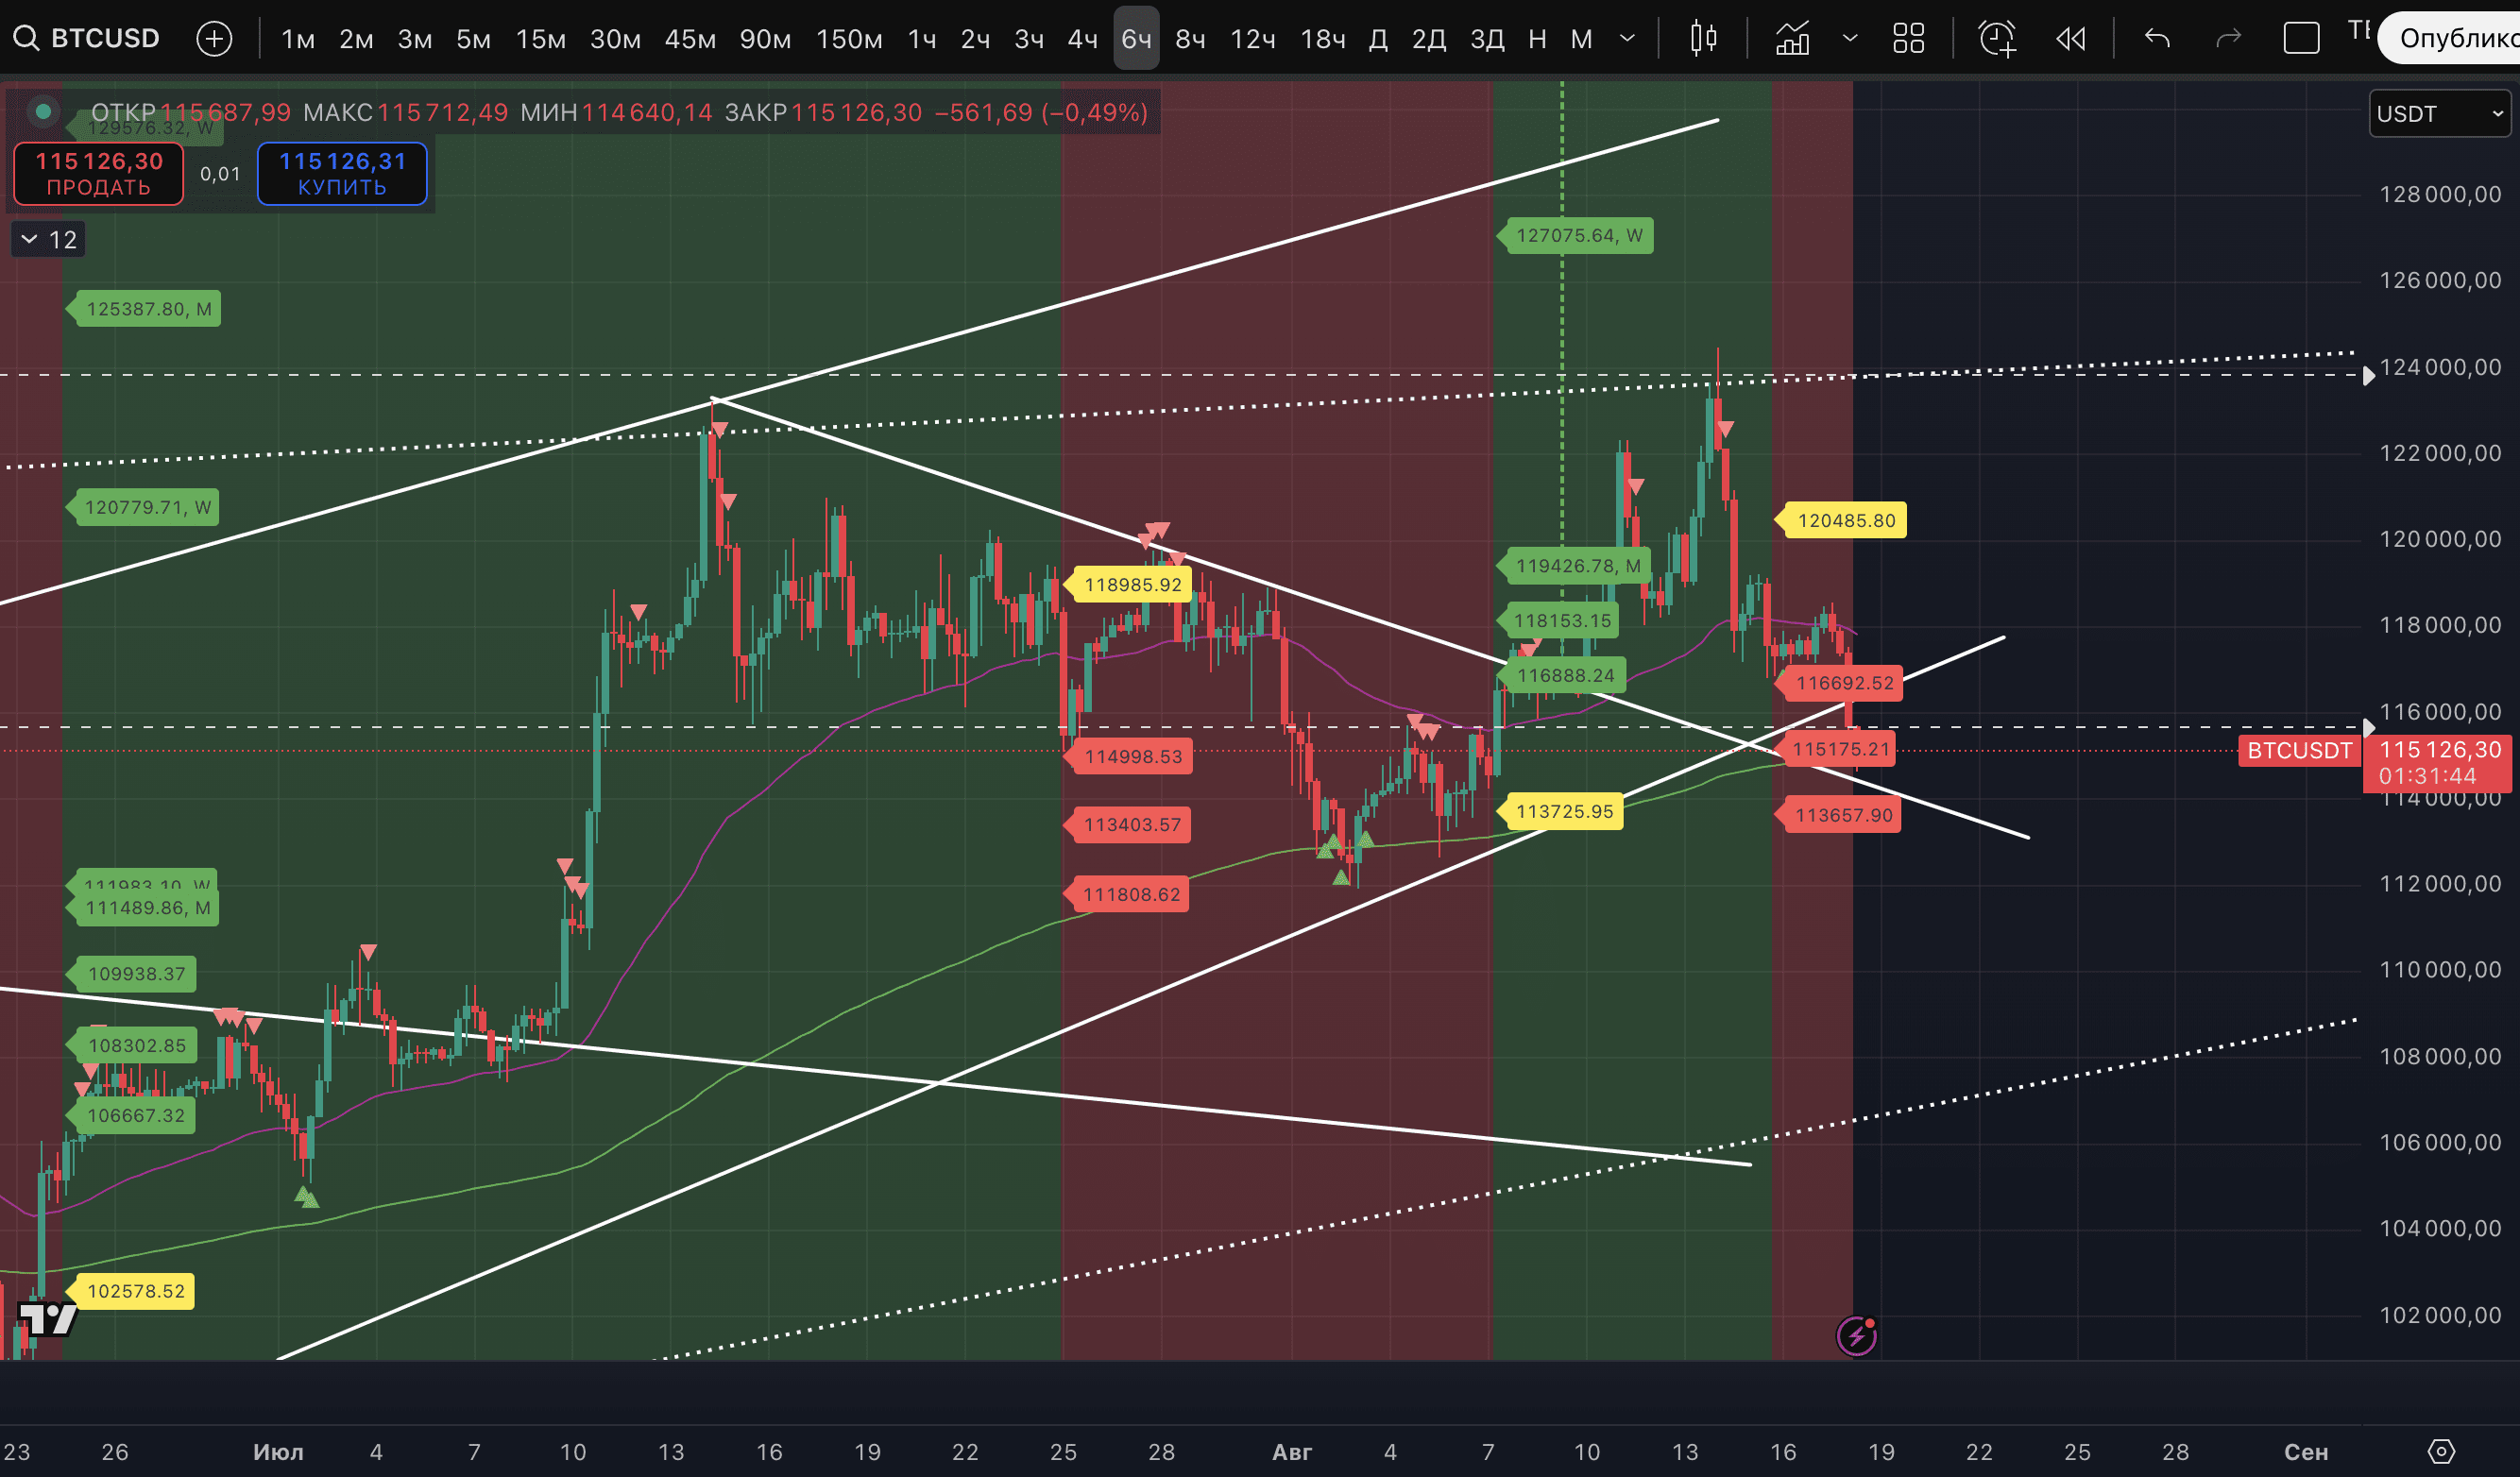
5. The second target of a stable downtrend on the 6-hour timeframe has been achieved at $115,175. The last one at $113,657 remains unfulfilled. The price has hit the support of EMA 200.
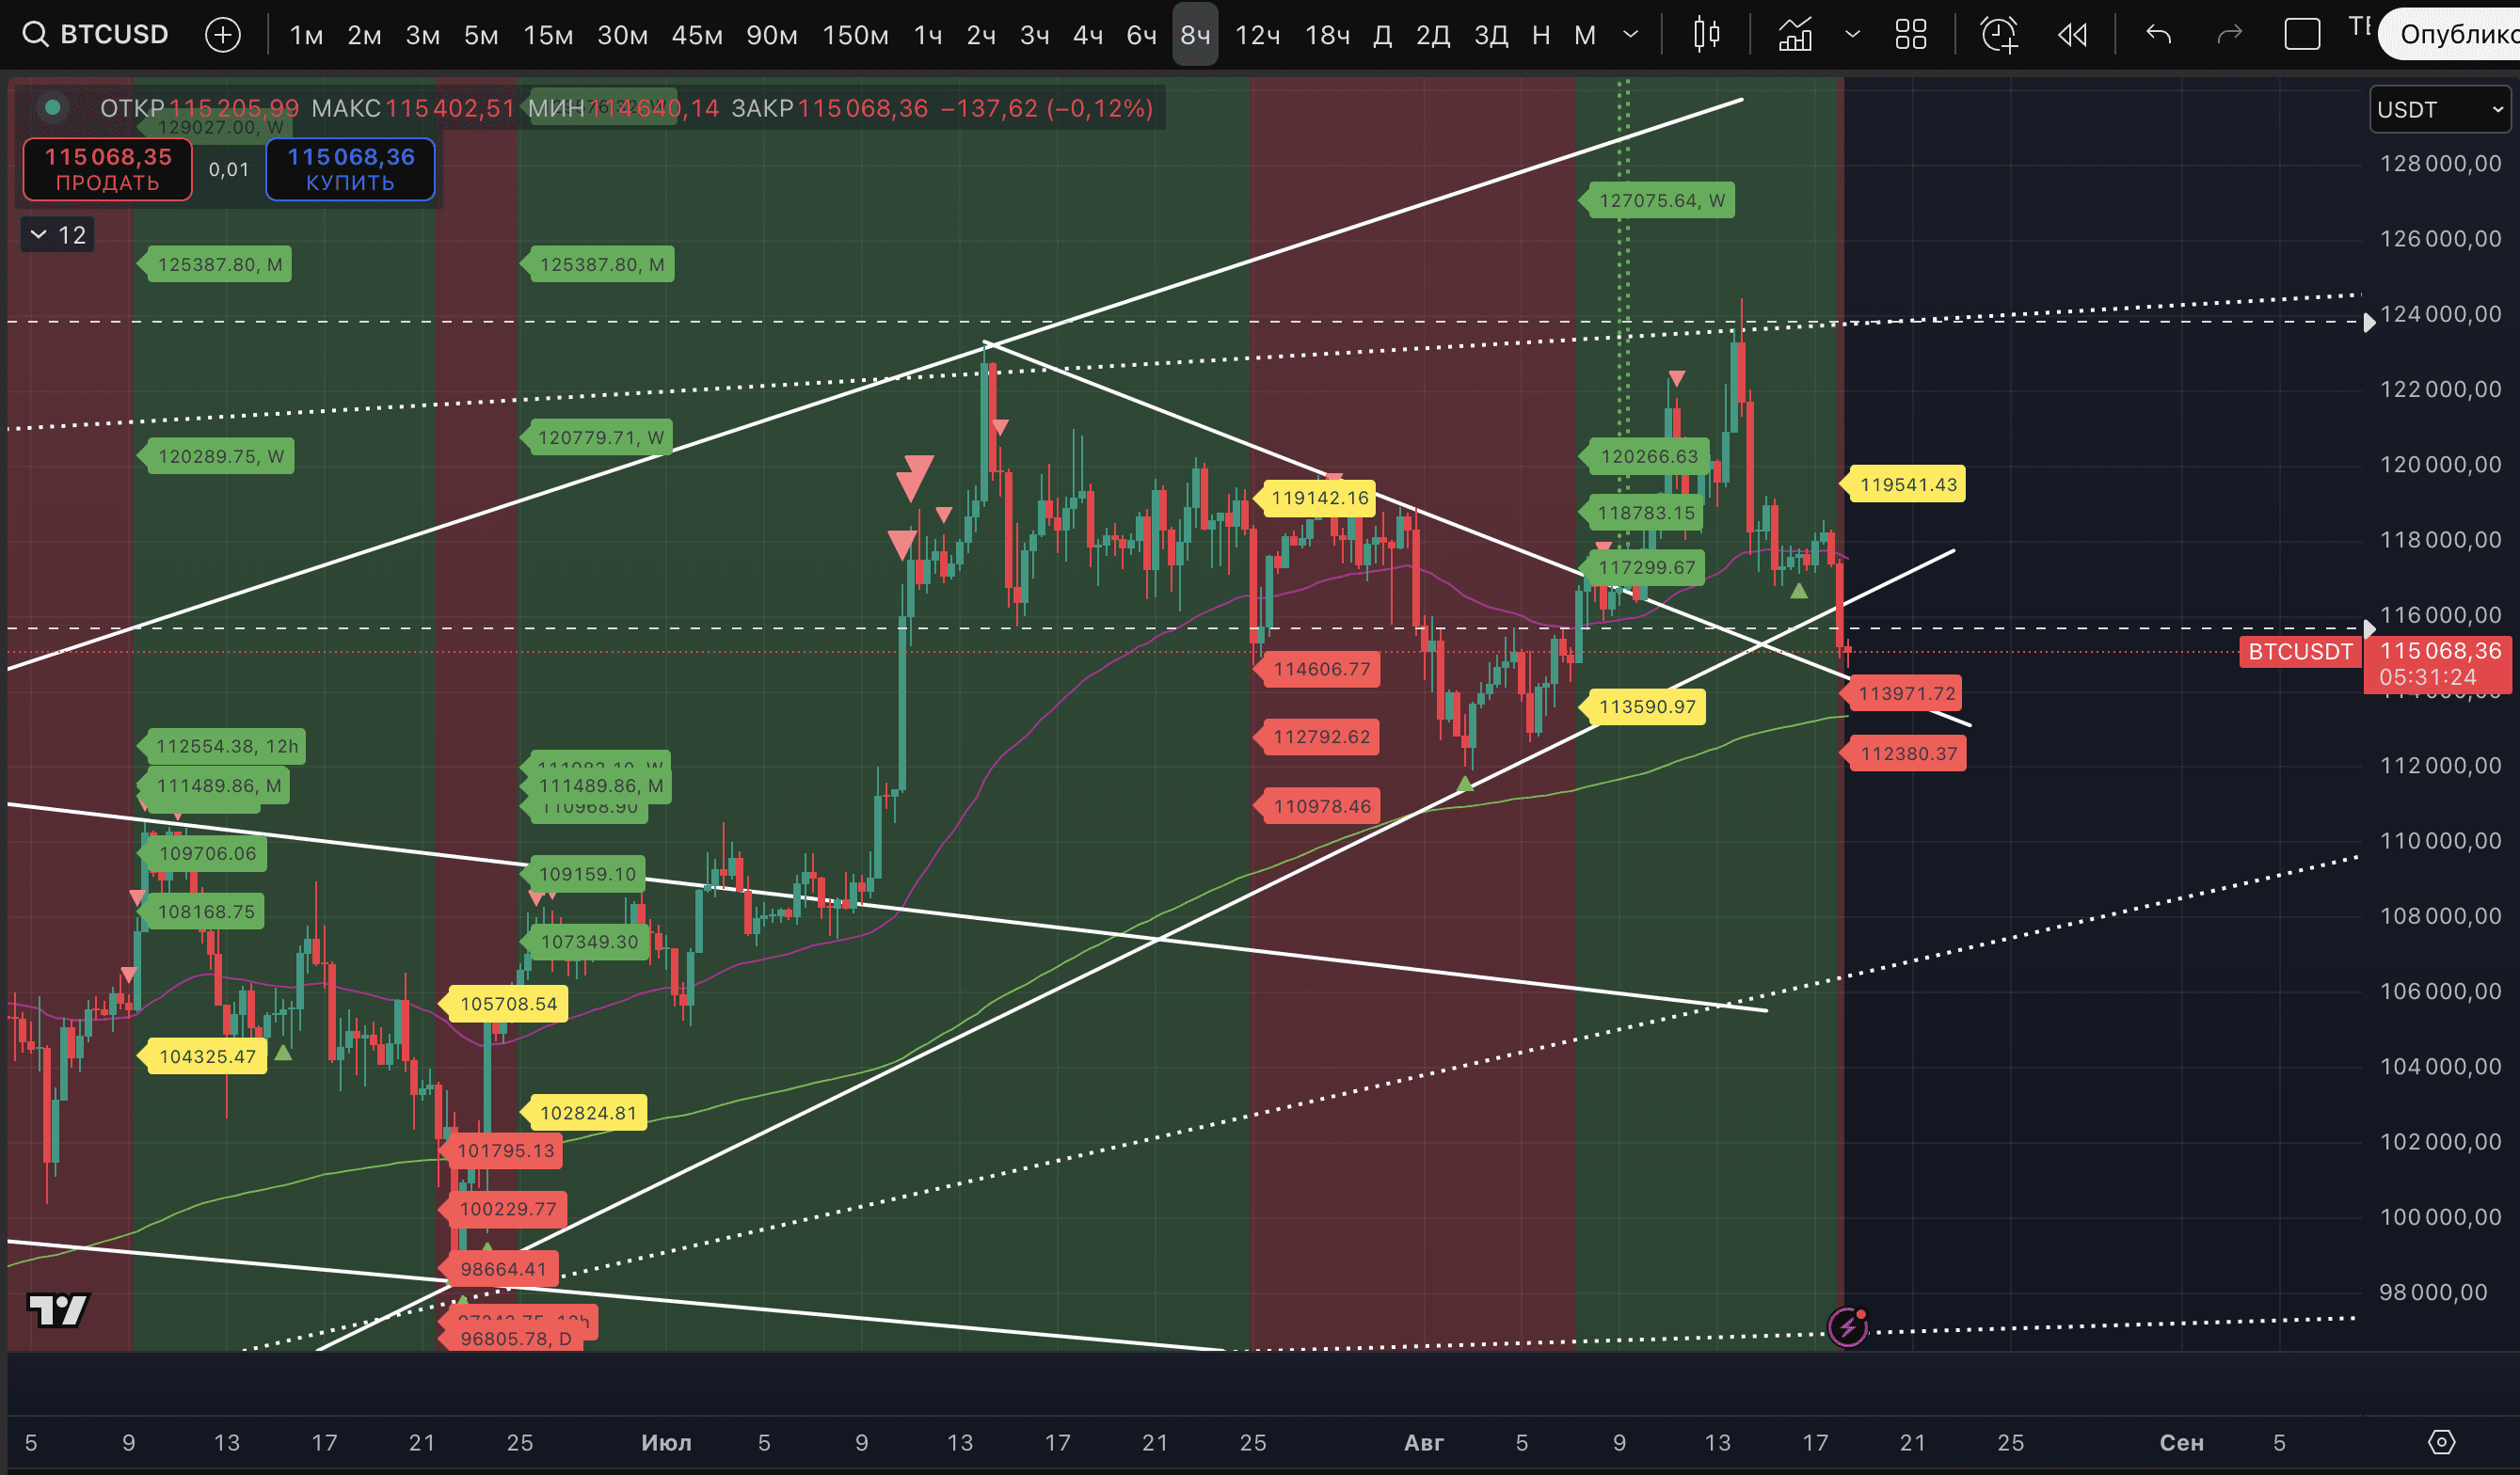
6. AT THE SAME TIME, the price has fallen into a stable downtrend on the 8-hour timeframe, with basic targets of $113,971 and $112,380.
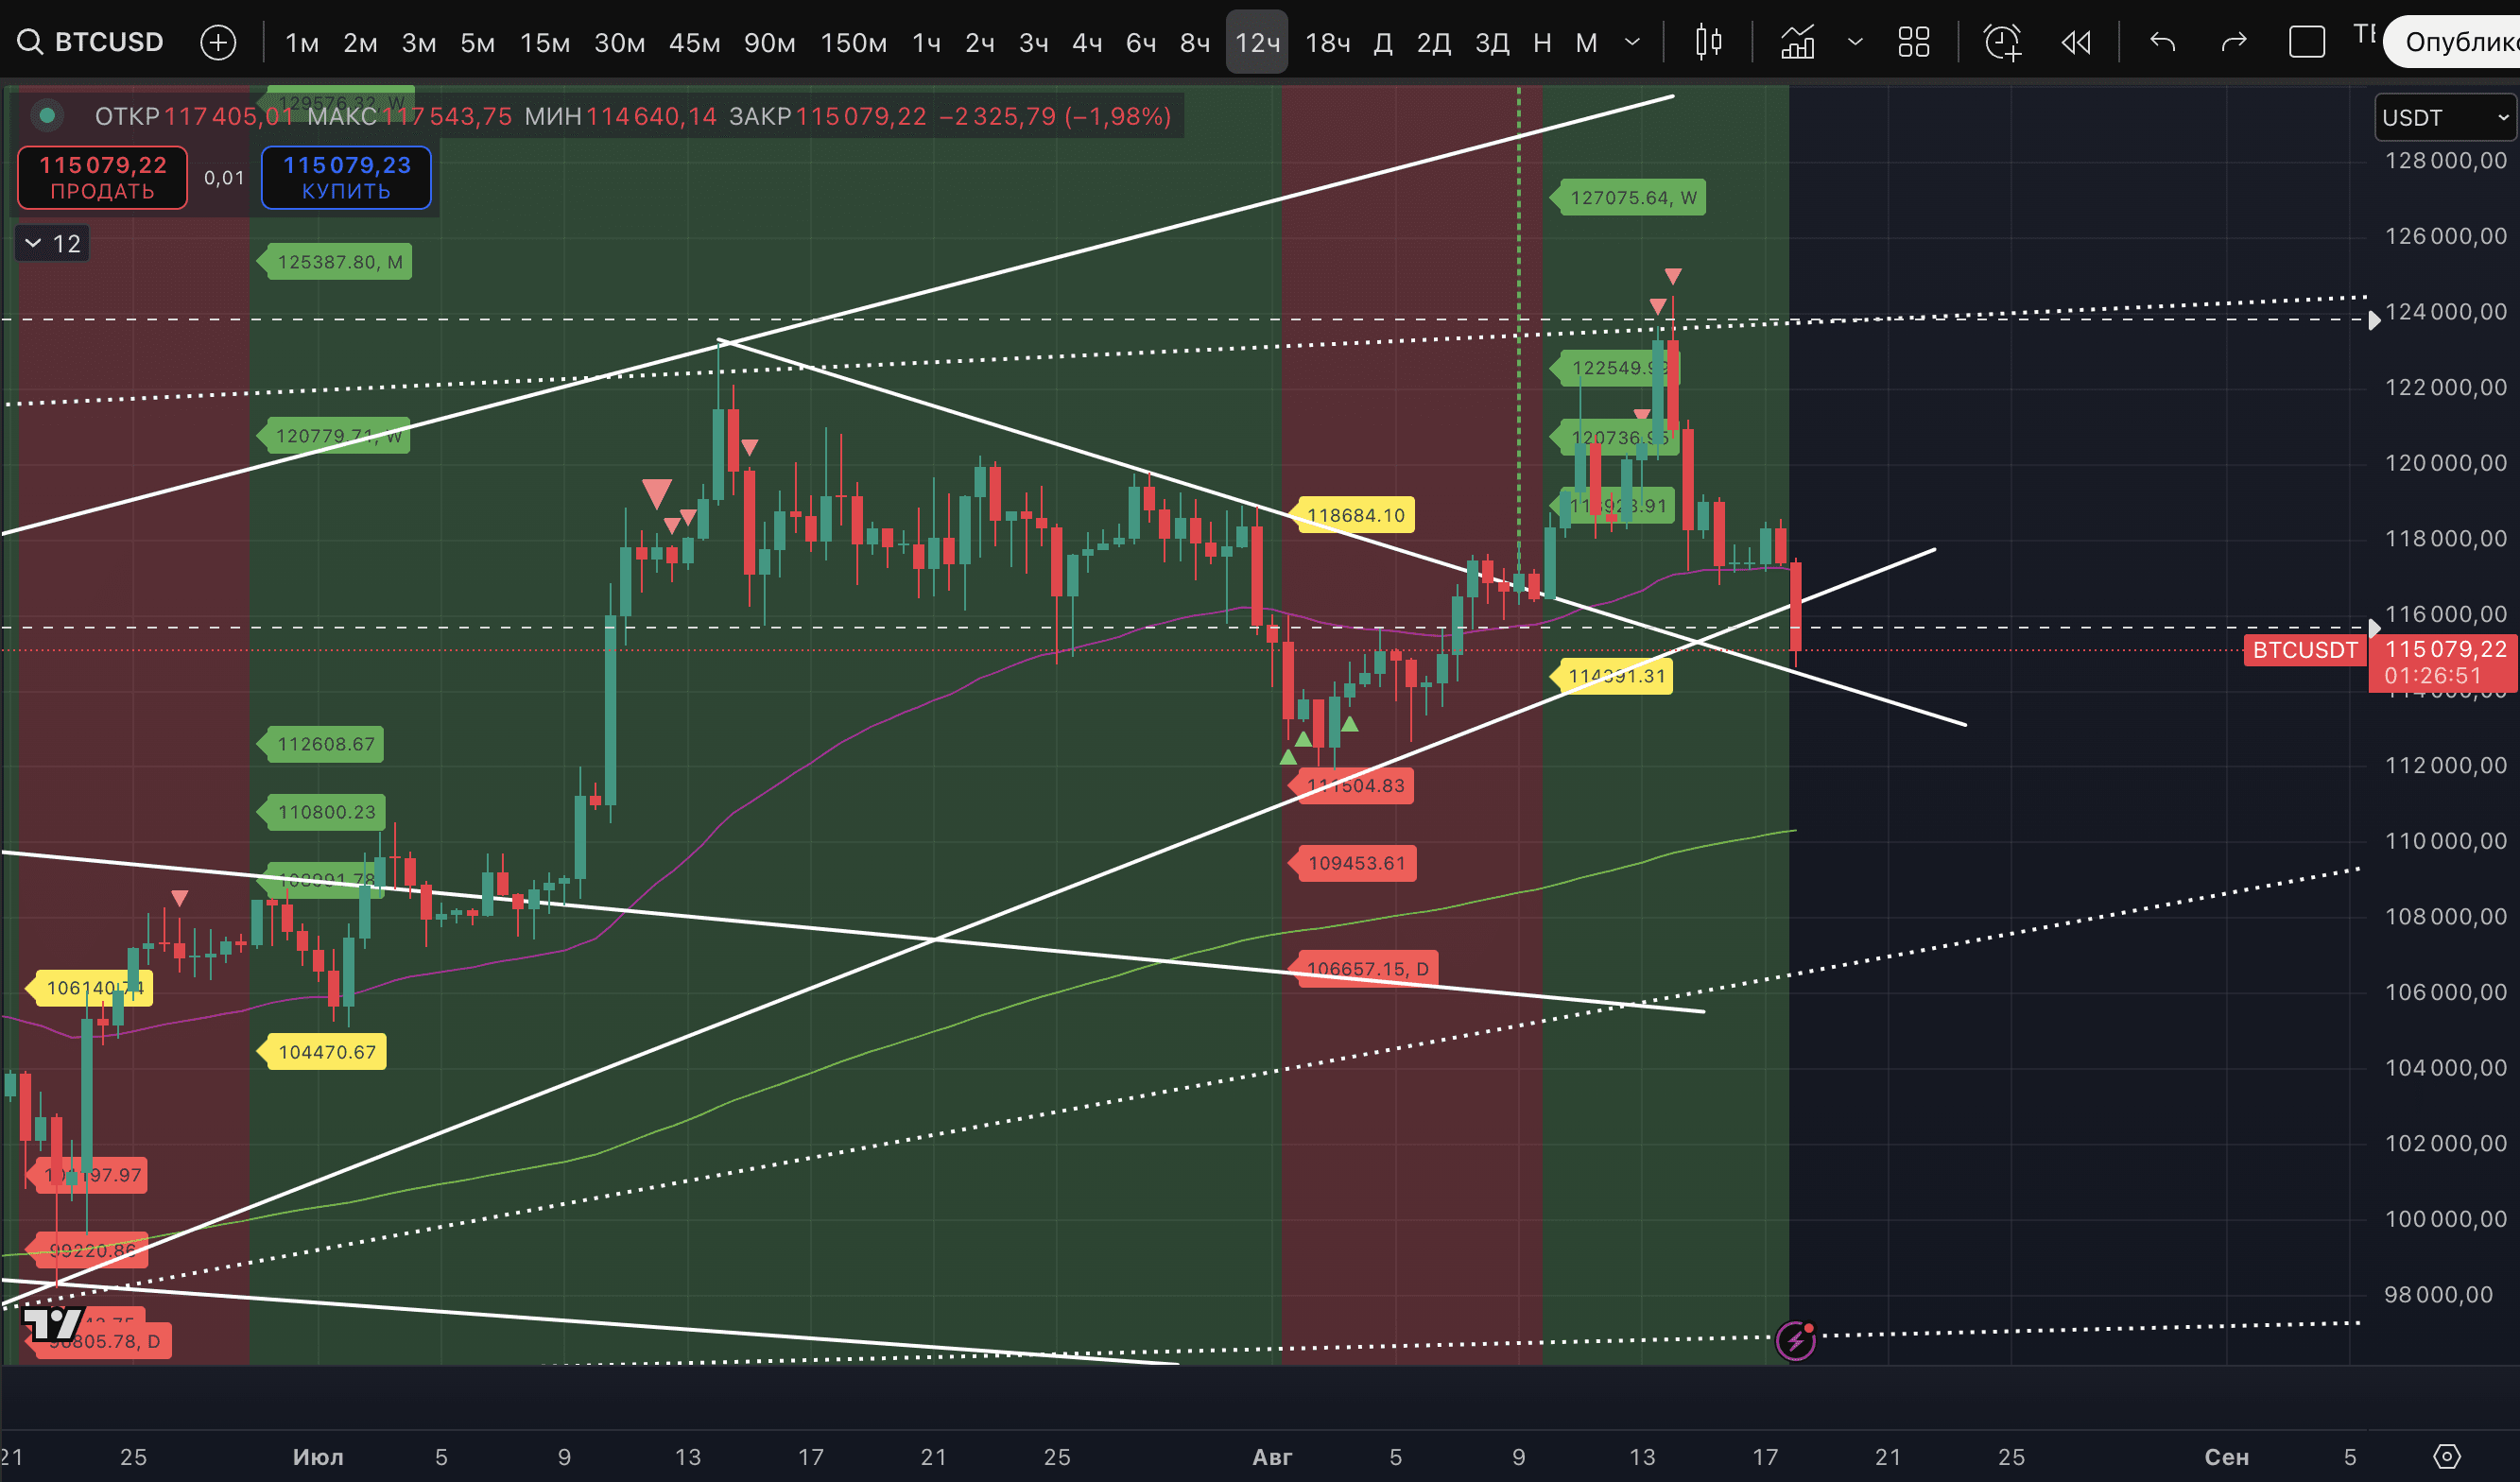
7. On the 12-hour timeframe, in less than an hour and a half, the 12-hour candle will close. If the price breaks down into the downtrend here, it will pose a risk of further decline and even a new low on August 3. By the way, on this same timeframe, it can be seen that the price has now come to retest the breakout trendline from July 14. This provides additional support for a possible rebound.
Now, locally, based on points 1-3, we are waiting for the development of a rebound. With a currently weak perspective for a full reversal. Considering that the price of #BTC:
- is testing the EMA 50 on the daily timeframe as an important support of the bull market,
- after the new ATH, it showed a decline of almost 8%, aggressively,
- maintains a stable uptrend on the daily timeframe,
- currently lower, but not far from the potential breakdown level of the uptrend on the daily timeframe at $115,638,
- has had an unfulfilled BUY signal from the Hash Ribbons indicator since July 23.
Therefore, for now, we are considering the possibility of starting to accumulate longs. Initially, we said that it makes sense to look at accumulating longs when reaching the level of $115,639. BUT for now, this may be a local movement. And again, on a small portion of our experiment's deposit with #futures_trade. It would be optimal for bulls to see a reversal from the current levels and a start of return to stable uptrends on the hourly and 2-hour timeframes. Then it could be assumed that the current low of $114,640 was the ideal entry point for accumulating longs. For now, there is no uptrend even on the 15-minute timeframe. Only on the 5-minute. We will wait for an uptrend on the 15-minute timeframe, reassess the chart, and make a decision.
It is concerning for growth and the approach to a new ATH, just like before. Markers of a potential high on the daily timeframe, which our indicator provided recently, on August 11-13, and two markers of a potential high on the weekly timeframe.
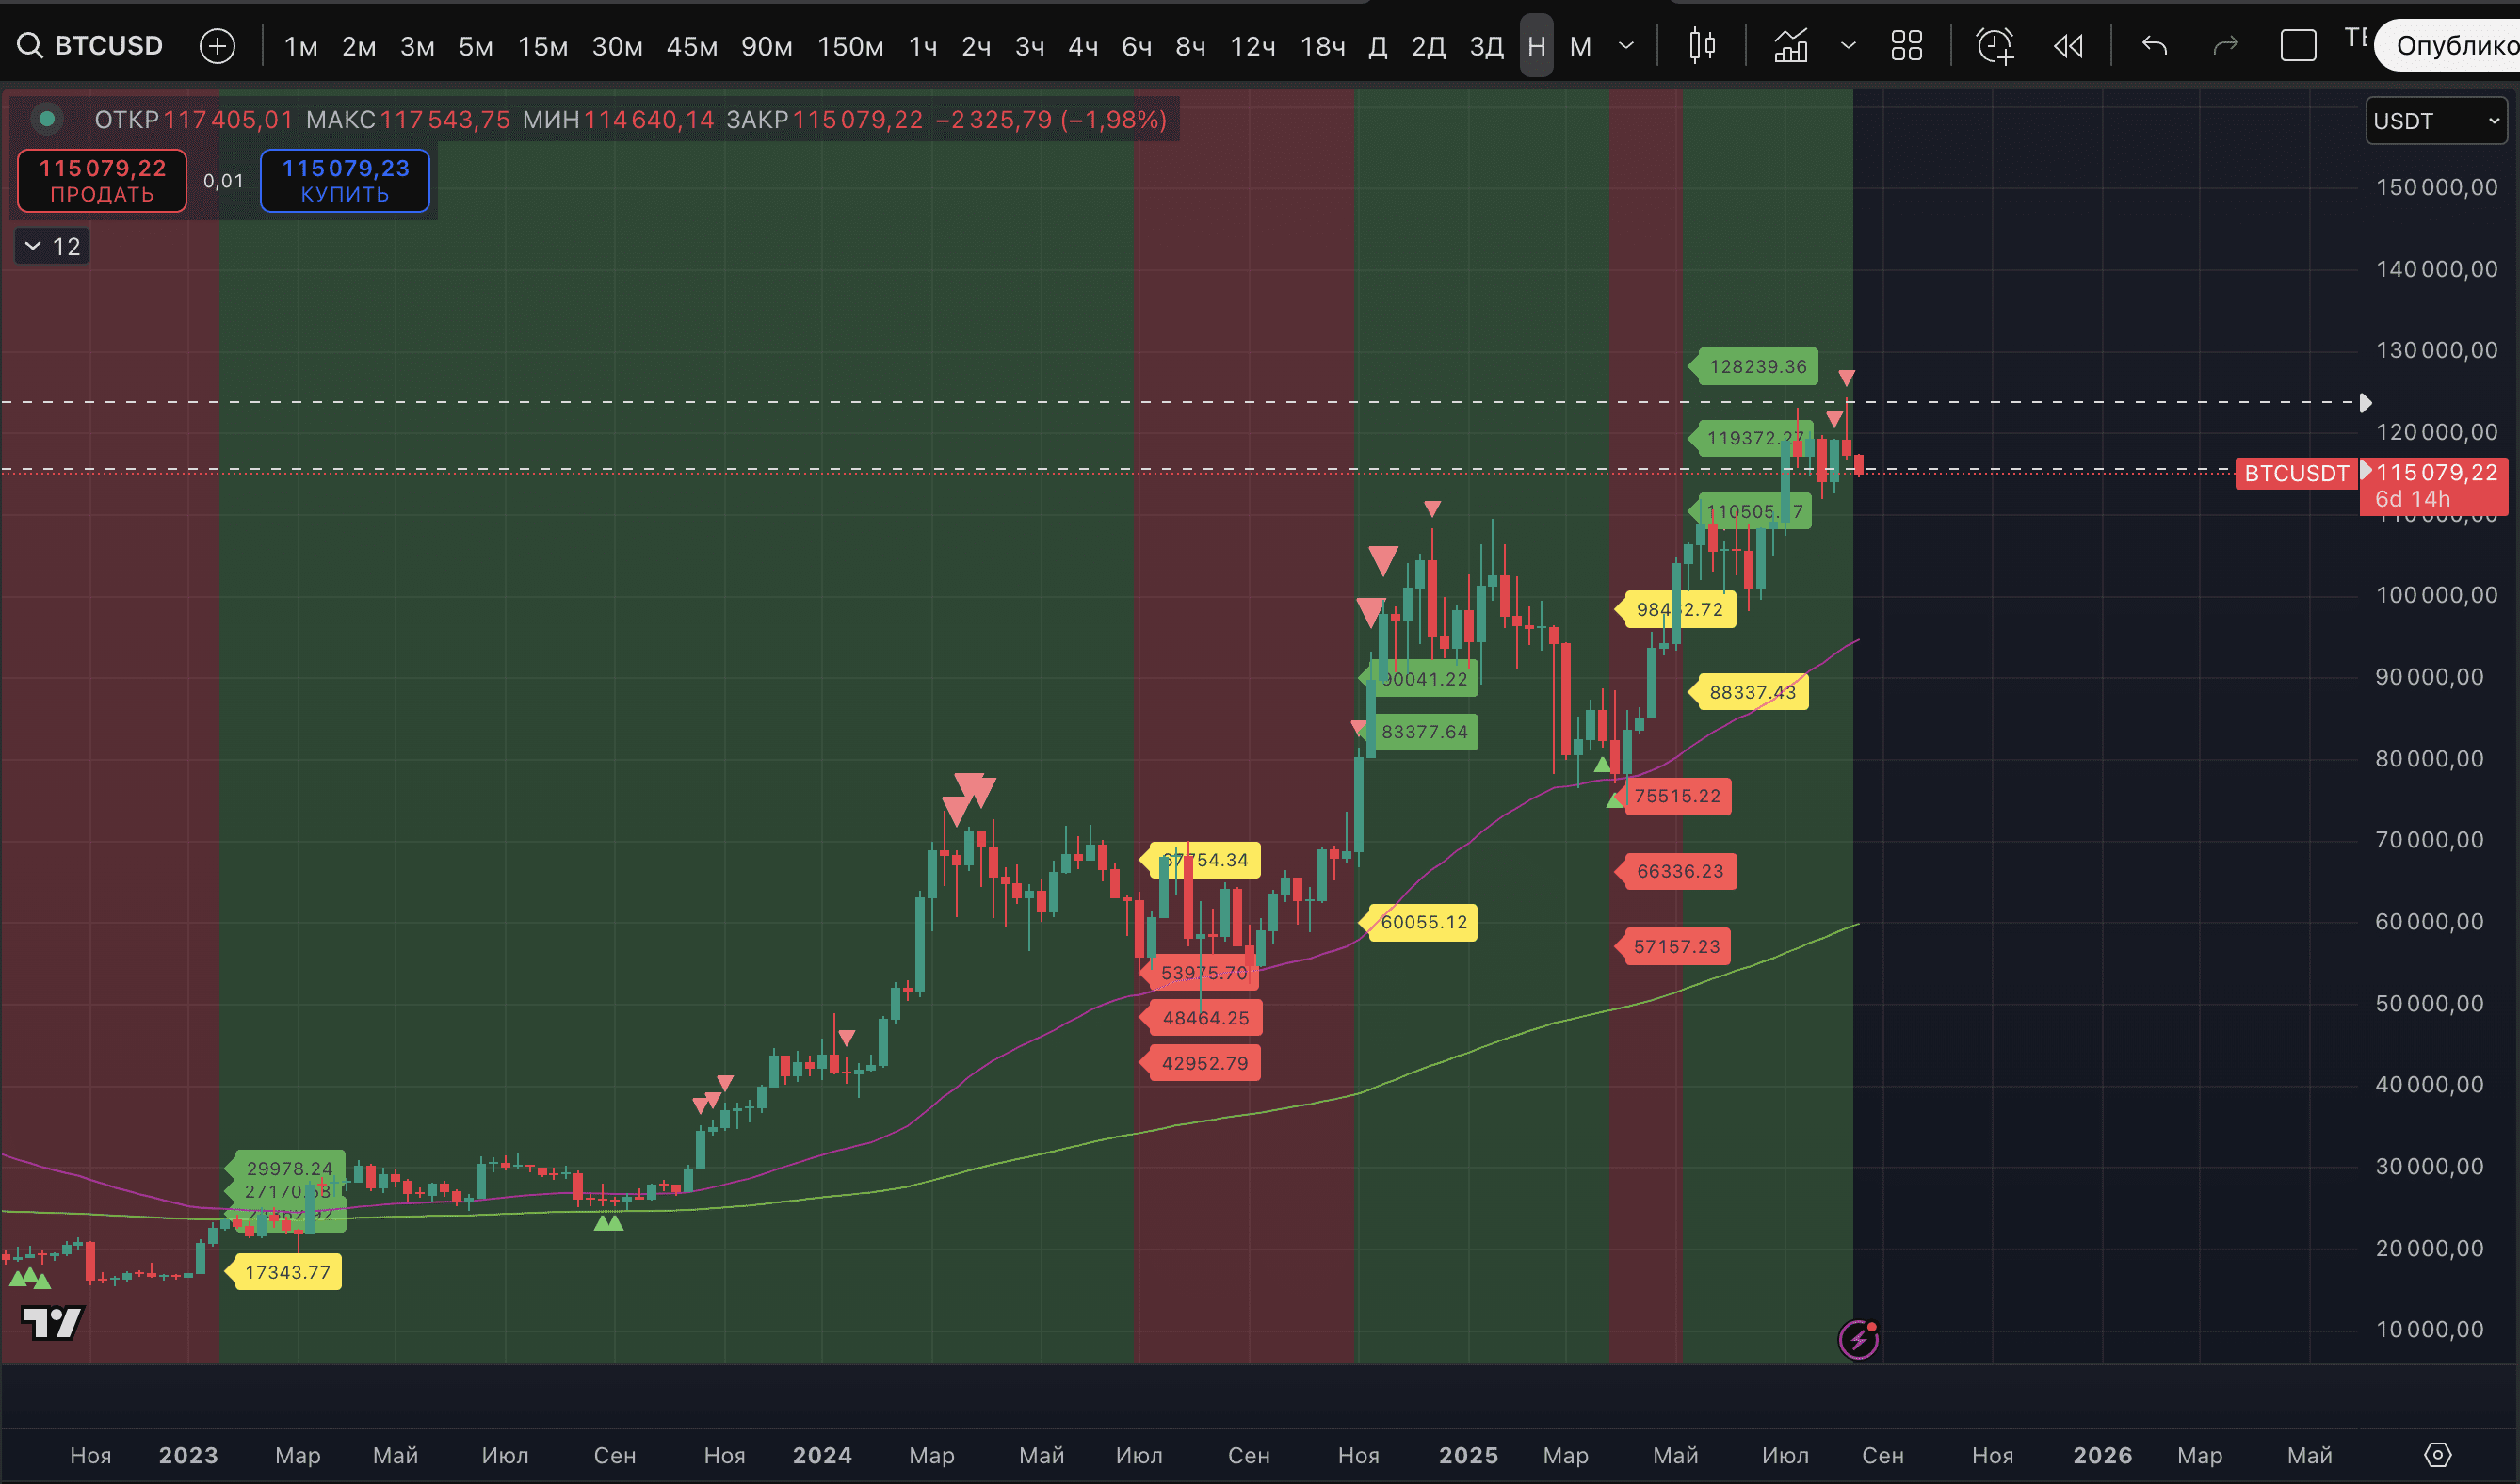
Bearish combo, we can see its execution. There is no marker on the current weekly candle because it is the first in a downward movement. In the case of a bullish impulse, the situation may change and we will get the third high marker out of three. But for now, the current picture is what can break the uptrend on the daily timeframe. Although it rarely breaks on this timeframe.
In this contradictory situation, it makes sense to work with trades specifically from extremes, and to reinforce positions (if at all) on additional signals - on new markers from older timeframes or on changes in stable trends. And if there are no additional signals and signs of the end of the trend appear - to take local movements. As we did today.
We are not even thinking about shorts without a significant rebound.
ps: the picture on important horizontal levels is on a separate screenshot.