$BTC continues to show signs of consolidation at elevated levels, and while the bullish trend is technically still intact, warning signals are starting to appear. Let’s break down the bigger picture and key support zones to watch in the coming days.
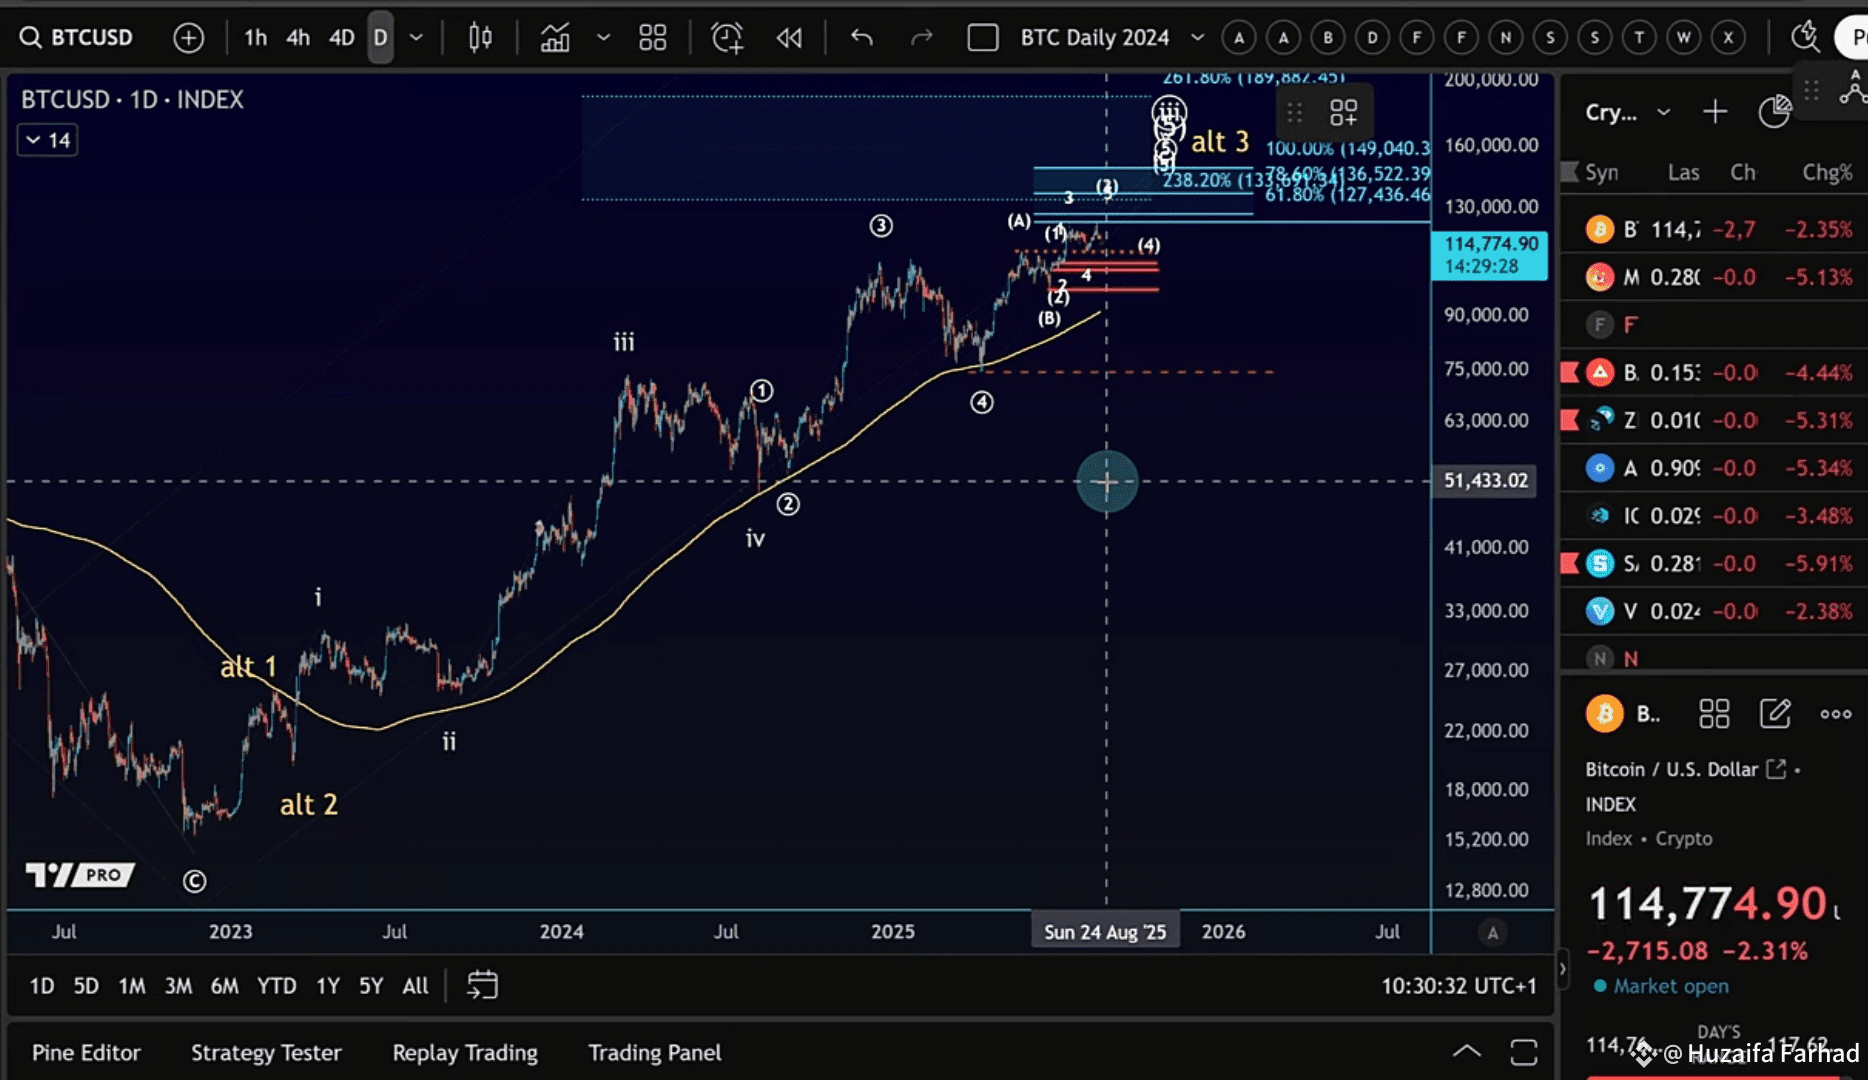
📈 The Bigger Picture: 5-Wave Structure Nearly Complete
On the higher timeframe, Bitcoin appears to have completed a classic Elliott Wave 5-pattern:
Wave 1
Wave 2
Wave 3
Wave 4
Wave 5 (potentially complete)
👉 At this stage, any upside moves would likely be limited to the nano-level. That means we could be very close to a major top, or it may already be in.
⚠️ First Signs of a Major Top
The first real confirmation of a larger correction would come with a 5-wave decline on the shorter timeframe. Until that happens, there’s no hard evidence that the top is locked in.
Key levels to watch:
112,000 → Break here = major warning for bulls
107,700 → Next support zone
105,550 → Deeper structural support
98,300 → Must-hold level for bulls in a fallback scenario
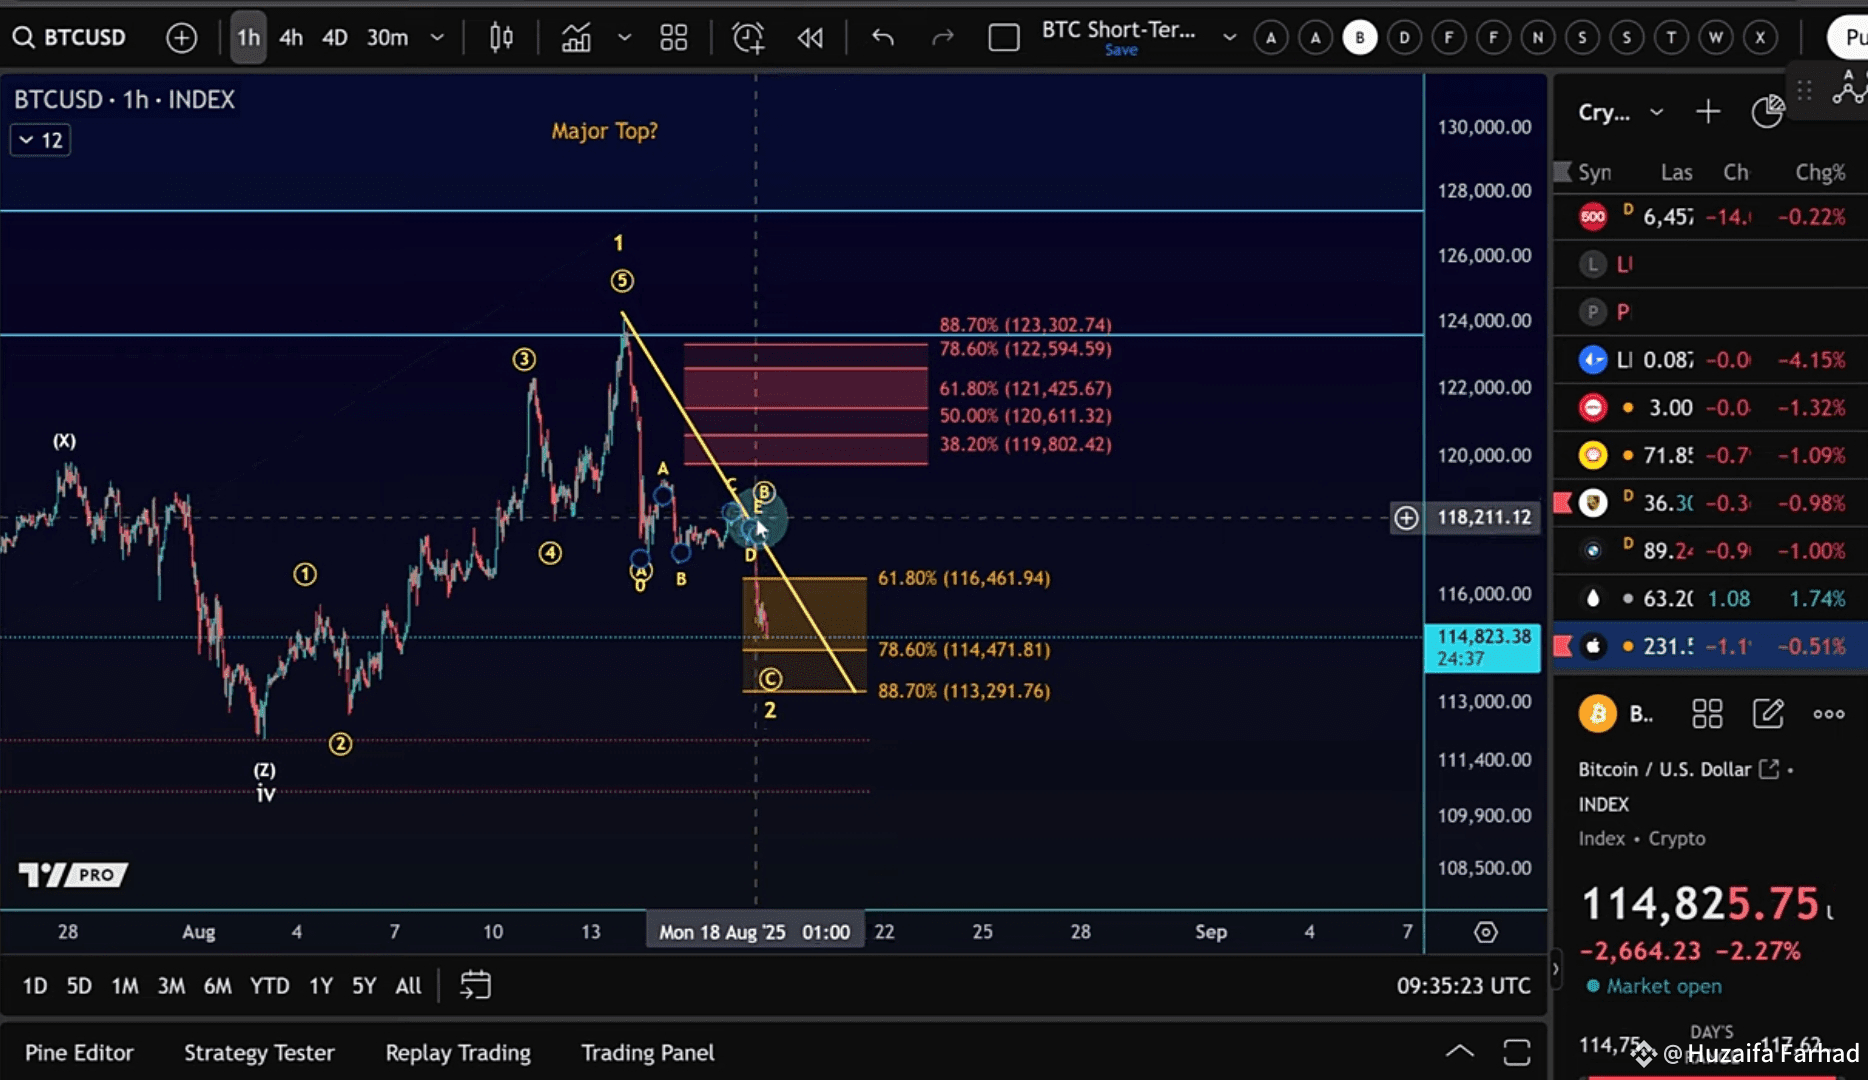
🔍 Micro-Level Weakness
On lower timeframes, the current pullback looks concerning:
We saw an A-wave down, followed by an extremely weak B-wave.
A healthy B-wave should have reached 120,600 – 121,400, but it failed.
This suggests the market could already be sliding into a C-wave decline.
If Bitcoin breaks below 114,470 (78.6% retracement), the next focus is 113,290. Losing those opens the door for a test of 112K.