While many thought Ethereum’s best days were behind it, the reversal call has now delivered over +200% gains — and ETH is once again knocking on the door of all-time highs near $4,800. $ETH
Ethereum Weekly Chart
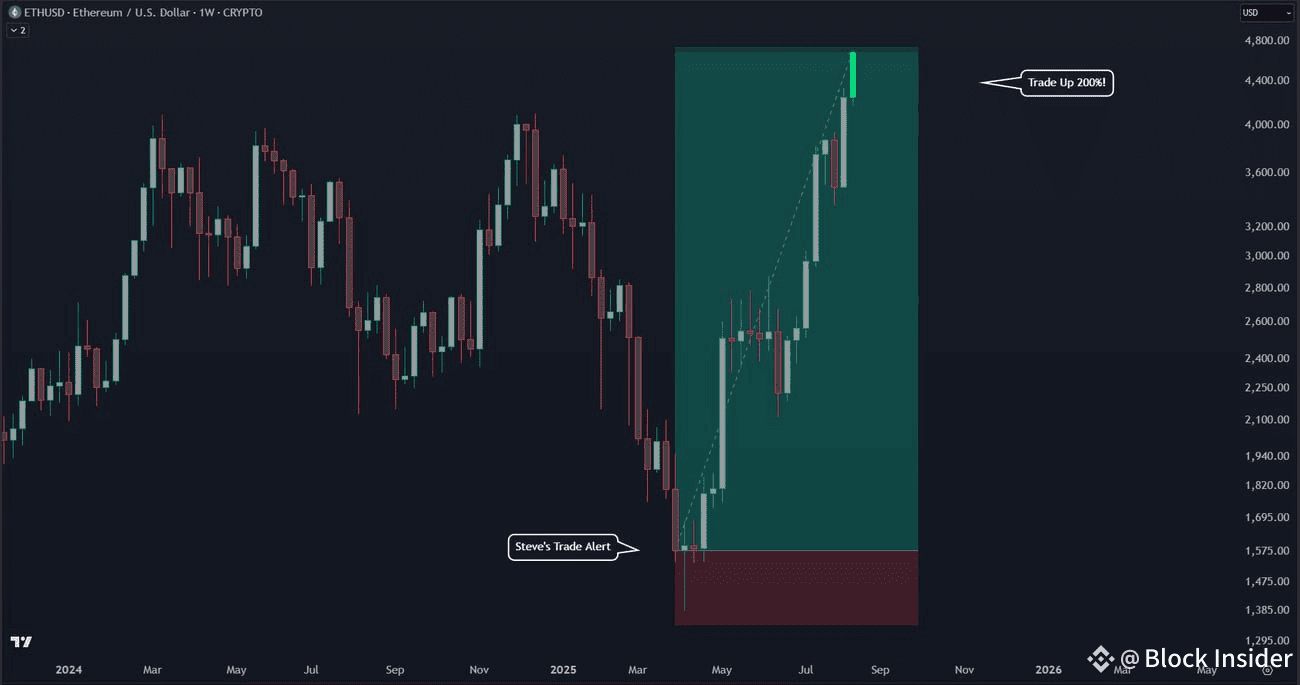
Competitors like Solana, SUI, and SEI have had their moments in the spotlight, but ETH continues to shine. The structure on the higher timeframes is eerily similar to its previous bull market breakout — and that could mean a Phase 4 expansion is next. $LDO
In this report, we’ll break down:
How ETH’s Fibonacci Phases point to potential $7,700–$9,800 targets
Key momentum signals from RSI and Stoch RSI
The “golden pocket” re-entry zone if we see a rejection
ETH Fib Phases – History Repeating?
Ethereum’s price is now in Phase 3 (blue box on chart), pressing against the $4,800 resistance. In the 2020–2021 cycle, breaking this phase triggered a rally to the 1.414 Fib extension, completing a full expansion leg.
If ETH breaches all-time highs with conviction, we’ll look for:
1.272 Fib Extension → ~$7,700
1.414 Fib Extension → ~$9,800
ETH - This Market Cycle
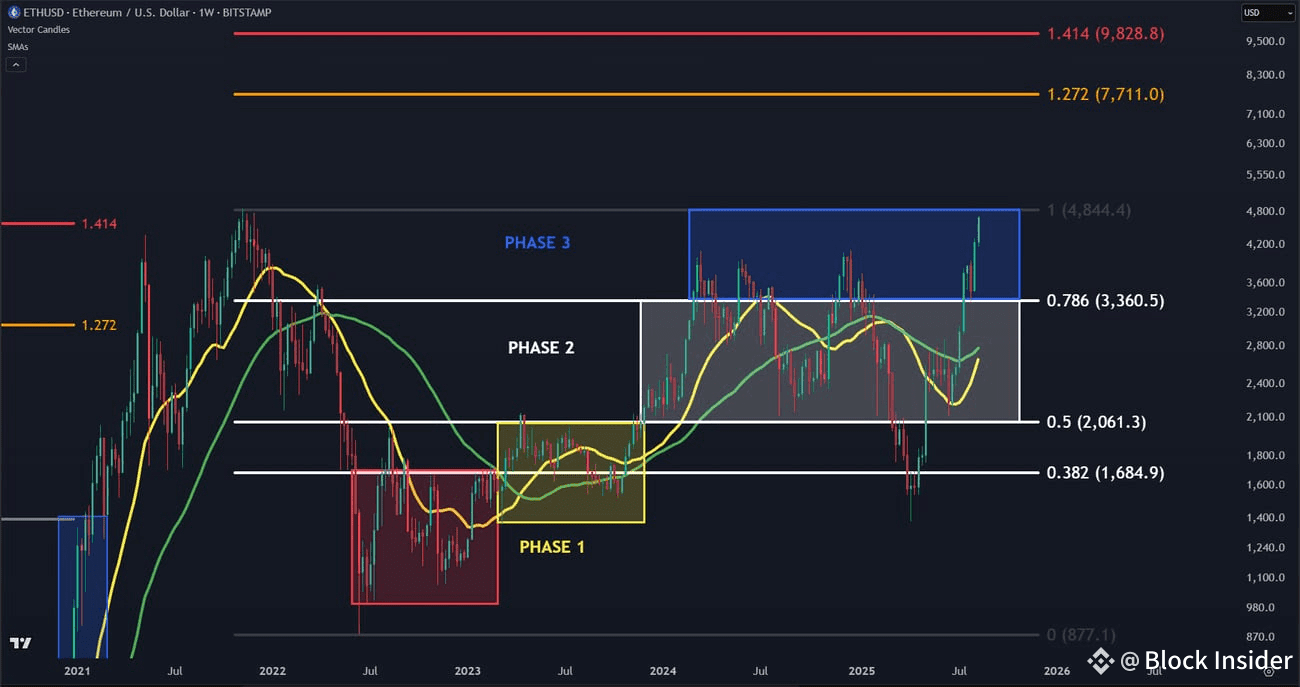
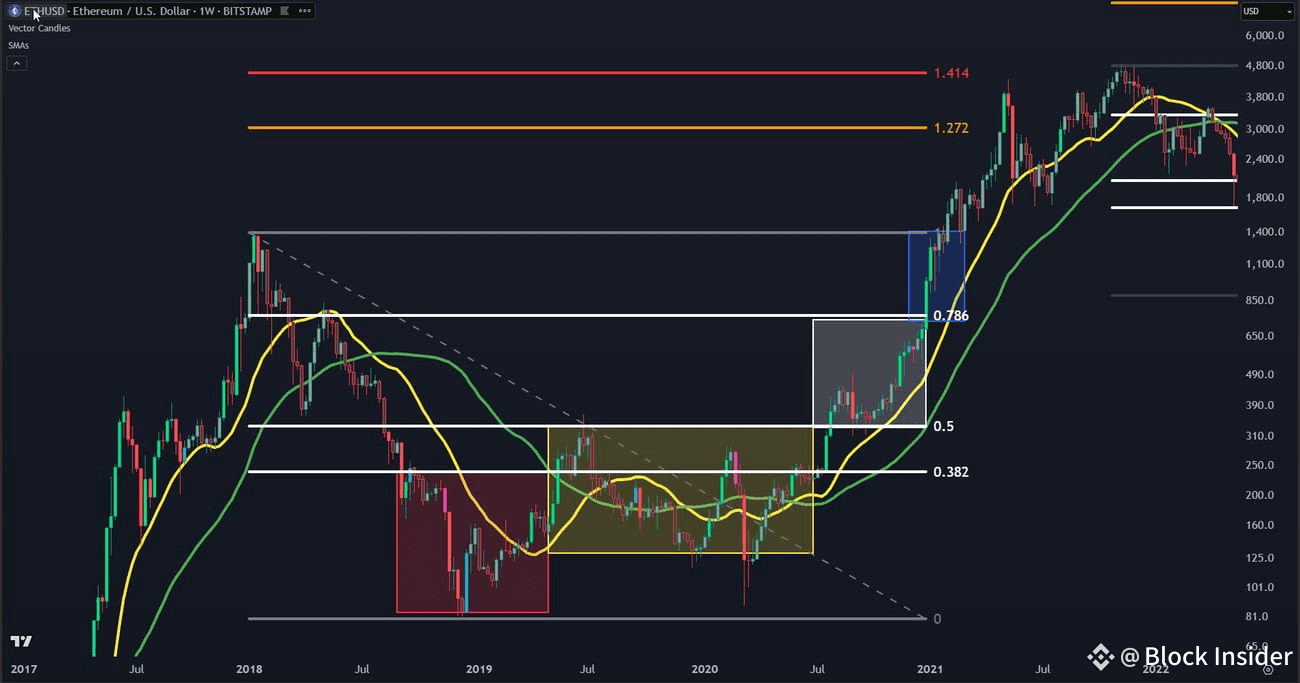
These levels align closely with the final expansion phase from the last bull run.
ETH - Last Market Cycle (2018 Bear Market to 2021 Bull Market)
What This Means for You
Ethereum is at a make-or-break point:
Above $4,800 → Open path to our higher targets between $7,700–$9,800
Rejection → Watch $3,600–$3,000 for accumulation #MetaplanetBTCPurchase
Let the weekly close guide you. Respect the golden pocket as the prime reload zone.


