We see two charts, and interestingly, they are from completely different eras. The first is ETH/USD over the past few years, and the second is the American Locomotive stock chart from the distant year of 1935. At first glance, they have nothing in common. But for an experienced trader, it is just another confirmation of the eternal laws of the market.
The main lesson: History does not repeat itself, but it rhymes.
It immediately stands out how similar the patterns are. Both assets, nearly 90 years apart, demonstrate classic technical analysis figures:
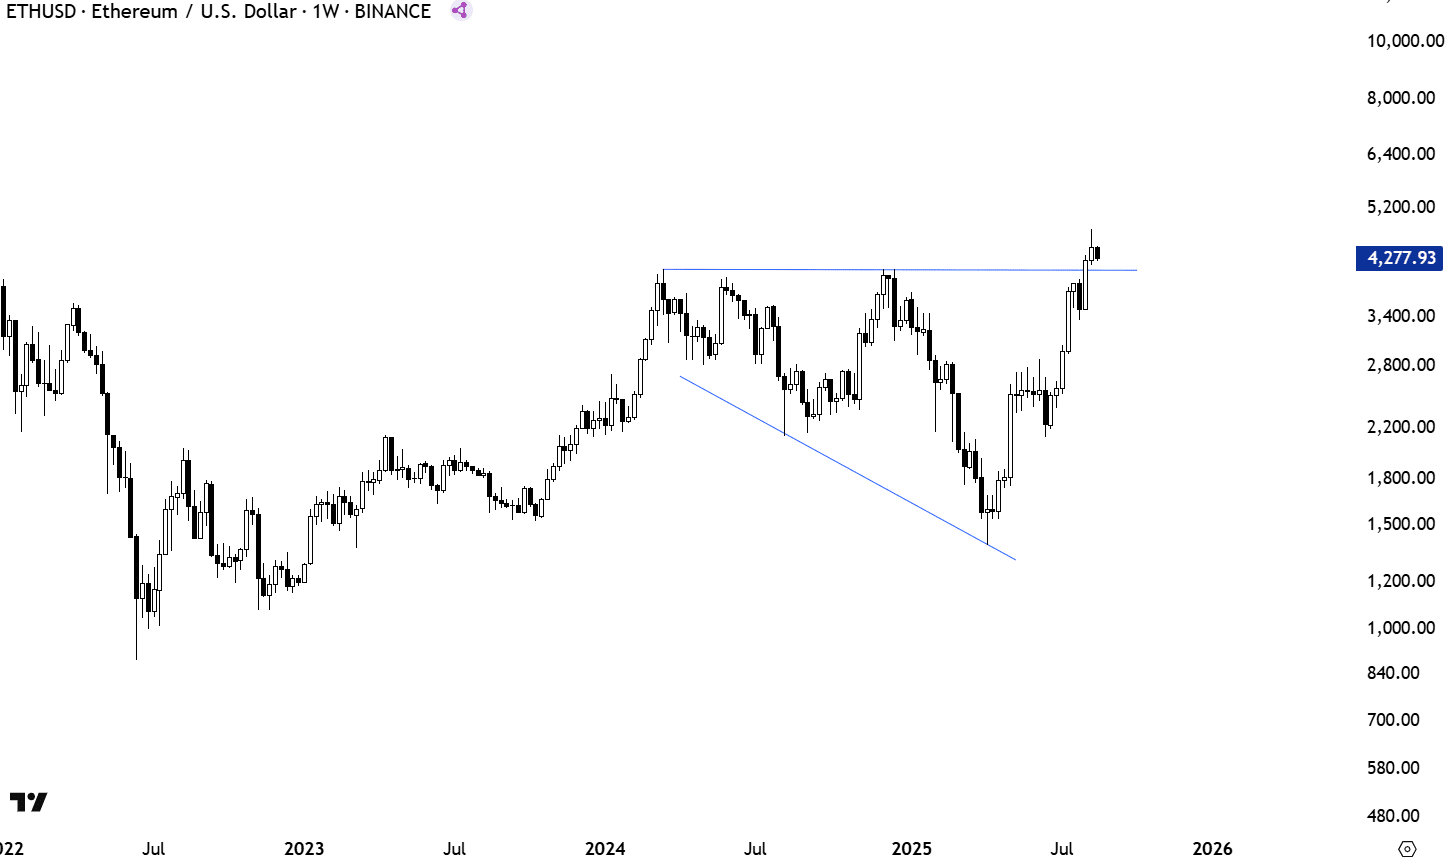
* ETH/USD (modern chart): We see how the price is forming a large bullish flag or ascending triangle after a strong upward movement. The price is consolidating, bouncing off the horizontal resistance around $4,000-$4,200 and gradually forming an ascending support. Now we see that the price has broken through this resistance. This is a very strong signal.
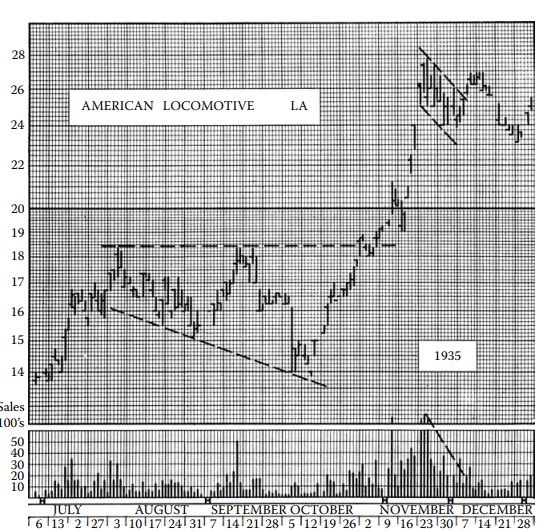
* American Locomotive (1935): Here we see the same pattern! The price, after a strong rise, is consolidating, forming a figure that looks very much like a bullish pennant or flag. Then, the price breaks through the upper boundary and goes into a powerful rise.
It is not a coincidence. This is the psychology of the crowd expressed in the movement of the price. People who traded in 1935 experienced the same emotions that we do today: fear, greed, euphoria, and despair. These emotions are reflected in the same recurring patterns.
What does this mean for me as a trader?
The breakout is a signal to act. On the ETH/USD chart, we see that the price has overcome a key resistance level. This indicates that buyers have finally gained the upper hand over sellers. In this situation, I would consider opening a long position (buy).
Volume confirms the trend. The American Locomotive chart shows a sharp spike in volume at the breakout, which confirms the strength of the movement. If the breakout is accompanied by an increase in volume, it makes the signal even more reliable.
Support and resistance levels are everything for us. The broken resistance level around $4,000-$4,200 now becomes a strong support level. If the price makes a "retest" and returns to this level, it will be an excellent entry point, as the risks will be minimal and the growth potential high.
Conclusion
Markets change, technologies change, but the psychology of the crowd remains the same. The American Locomotive chart from 1935 is not just a historical picture, but a textbook on trading. It shows that, regardless of time, the same patterns work because they are based on fundamental human emotions.
Currently on the ETH/USD chart, we see a classic bullish signal. This is not a guarantee of success, but in terms of probability, the chances of continued growth are very high. As a trader, I would use this signal, keeping in mind strict risk management.
Subscribe, like, and I will keep you informed with the highest quality information. #PsicologiaTrading $ETH