Introduction
In the summer of 2025, the Bitcoin market underwent significant structural changes, with the week from August 8 to 14 being particularly active and volatile. Turing M, through leading blockchain on-chain data and derivatives market monitoring, combined with ETF fund flows, holder behavior, and market sentiment, revealed the core driving factors behind the market during this period and future trend outlook. This report focuses on Bitcoin's price breaking through the historical threshold of $123,000 and the accompanying market behavior, providing detailed data insights and risk assessments for investors and institutional managers.
I. Review of Macro Price Trends
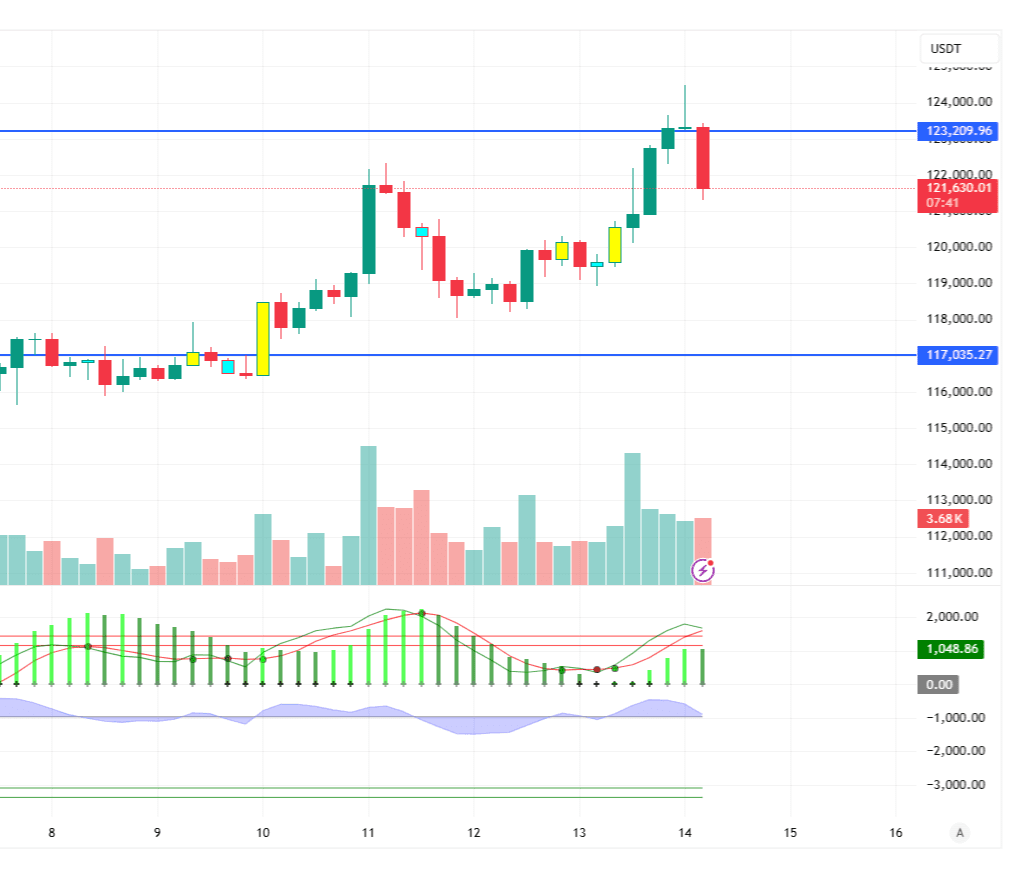
During the week, Bitcoin's price showed a strong upward momentum, gradually climbing from about $117,486 on August 8 to a closing price of $119,024 on the 14th, with a weekly increase of about 1.31%. The most critical breakout event occurred on the evening of August 13 at 20:00, when Bitcoin broke through the $123,000 mark under strong buying pressure, instantly reaching a historical high of $123,219, almost replicating the high of $123,180 on July 14. This move not only refreshed the historical price record but also marked a continuous strengthening of market bullish forces, with significant positive overlap effects from both technical and fundamental factors.
II. On-chain Data Analysis
Cost of holding and profit situation
Glassnode data shows that the average holding cost of short-term holders has significantly increased, surpassing $120,000 by more than one standard deviation, reflecting a large inflow of new funds into the market recently. Short-term holders are actively participating in this rally, showing a significant increase in trading activity and market participant confidence. Nonetheless, long-term holders still dominate the market, with their unrealized profits continuing to rise, and overall holding sentiment remains robust, with no signs of large-scale cashing out or profit-taking pressure. The confidence of long-term holders provides a solid psychological support layer for the price.
Trading Volume and Liquidity
This week, on-chain trading volume significantly increased, with about 33% of trading volume conducted through centralized exchanges, reflecting an increase in investor trading activity. The daily inflow and outflow of funds from exchanges ranged between $4 billion and $8 billion, showing ample market liquidity. Meanwhile, the number of stablecoins flowing into exchanges increased by about 15%, indicating that new fiat capital is preparing to enter the market, providing ample ammunition for price increases. Concentrated funds are flowing into ETFs and institutional custody accounts, further promoting the continuous inflow of institutional funds.
Number of Active Addresses
According to Glassnode data, the number of active addresses on the Bitcoin chain slightly decreased from 3.52 million to 3.51 million compared to the previous week, but it remains at a near two-month high. The number of new addresses has increased for four consecutive weeks, reaching the highest single-week number in nearly two months this week, indicating an increased willingness of new funds to enter the market, maintaining high market participation.
Market Depth and Order Book Performance
With the help of exchange on-chain asset tagging, Glassnode observed a significant enhancement in BTC market depth, with large buy orders evenly distributed, reducing trading slippage, creating a more favorable environment for large trading activities, helping to reduce short-term volatility, and promoting a healthy price discovery mechanism.
On-chain anomalies:
CoinGlass data shows a clear trend of funds flowing out of exchanges recently, with a net outflow indicating low selling pressure, suggesting that investors are more inclined to hold rather than sell immediately.
III. Derivatives and ETF Market Dynamics
ETF Fund Inflow Status
As of August 14, the cumulative fund inflow related to BTC ETFs remains high, with a net inflow of several hundred million dollars in the past week. Top management institutions like BlackRock and Fidelity maintain a low cost basis (about $69,200 and $57,400), solidifying a strong bottom for the market. Moreover, the increase in ETF holdings enhances market liquidity and stability, reflecting institutions' recognition of long-term bullish prospects.
Options and Futures Market Sentiment
In the options market, Glassnode data shows a significant increase in the demand for call options, with daily average option premium expenditures gradually rising, indicating that investors are optimistic about future price increases. At the same time, open interest in options continues to hit new highs, reaching $43 billion, especially with a significant proportion of call options with strike prices above $70,000, revealing market expectations that Bitcoin will enter a new upward cycle.
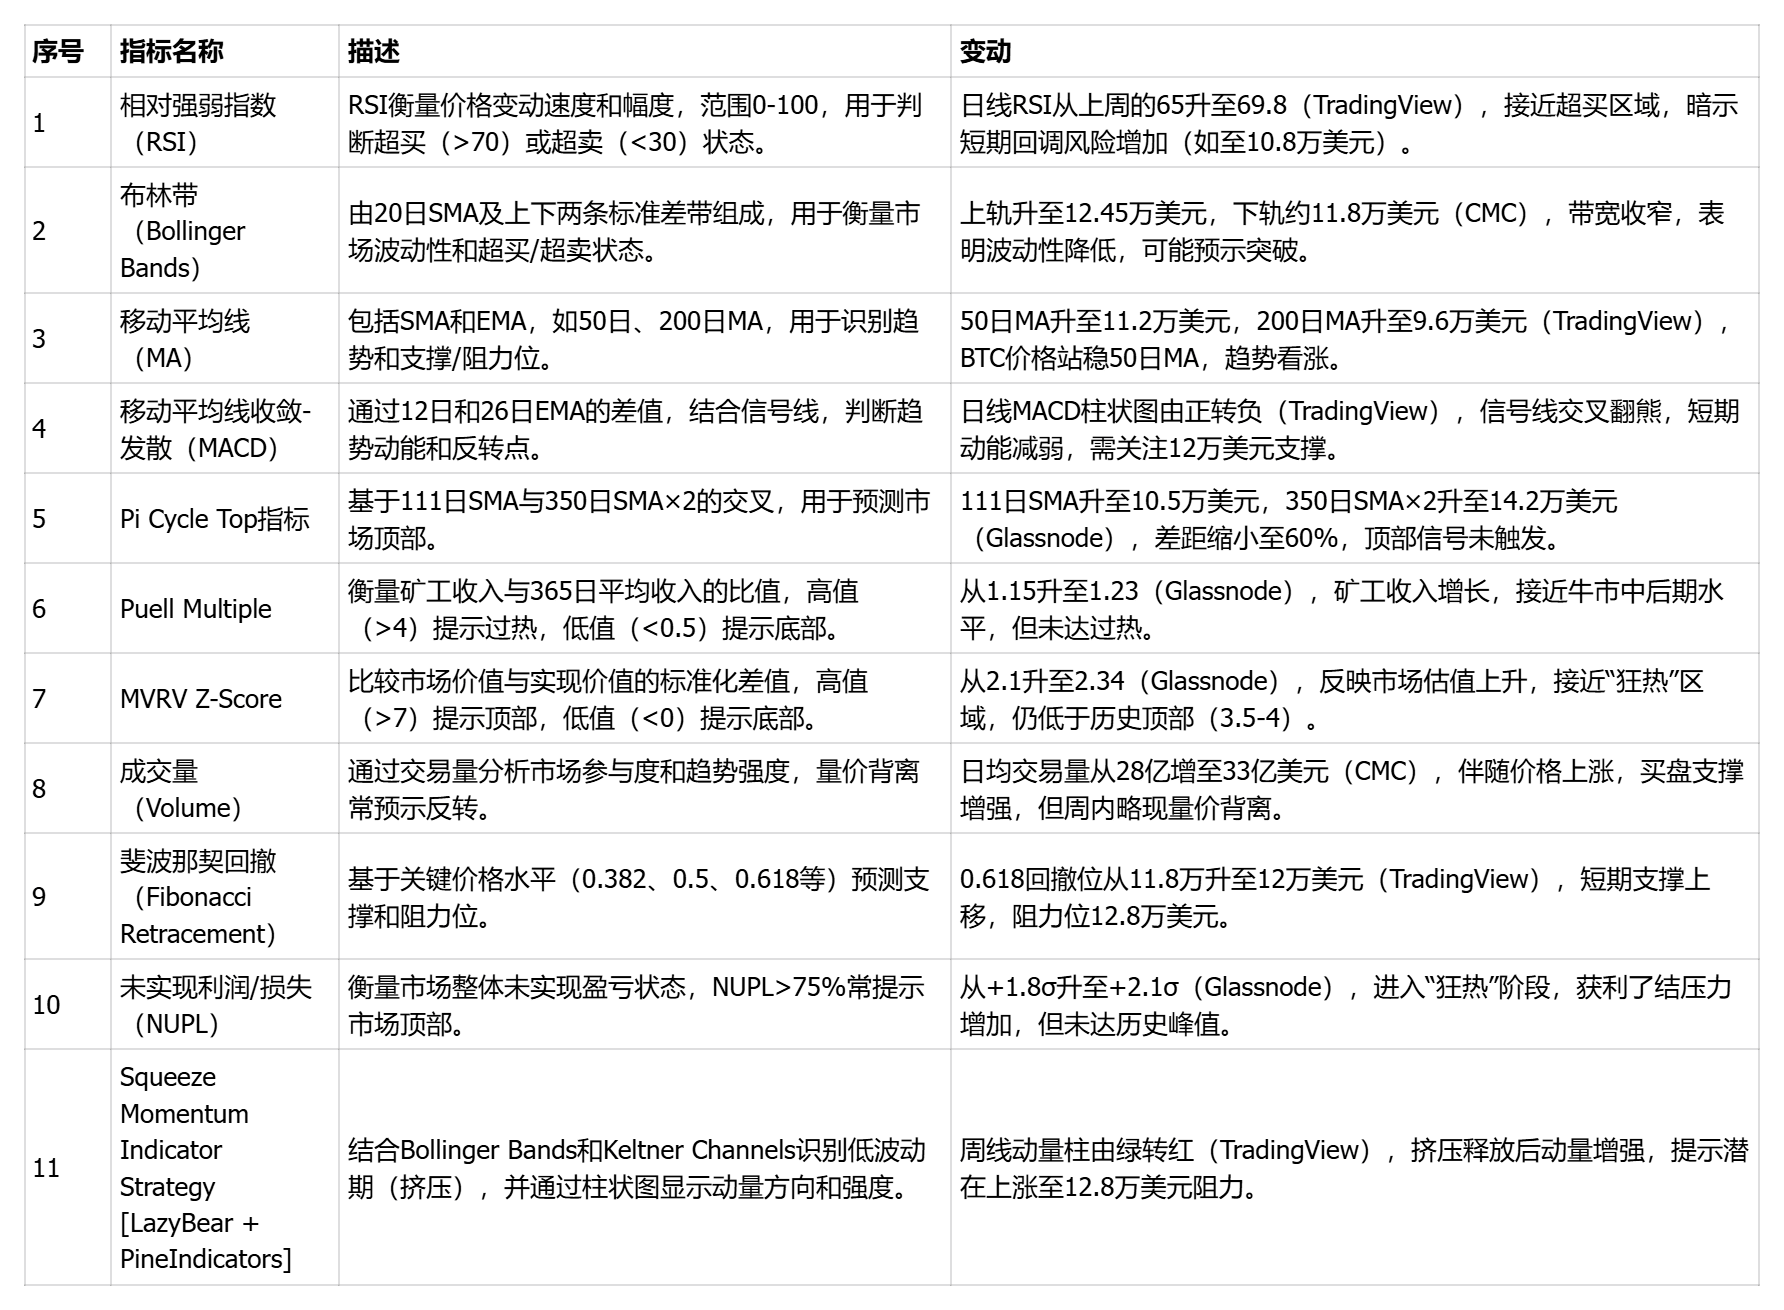
In the futures market, institutional investors' long positions are relatively concentrated, with technical indicators like RSI steadily maintaining above 60, and MACD gradually approaching a bullish crossover, indicating strong short-term price momentum.
IV. Technical Indicators
Support levels: $119,383 as short-term support, $116,700 as secondary support, $111,920 as key long-term support.
Resistance levels: After breaking $123,218, the next resistance target is set at $128,000, with further targets looking towards $130,000 and higher ranges.
V. Market Sentiment and User Behavior
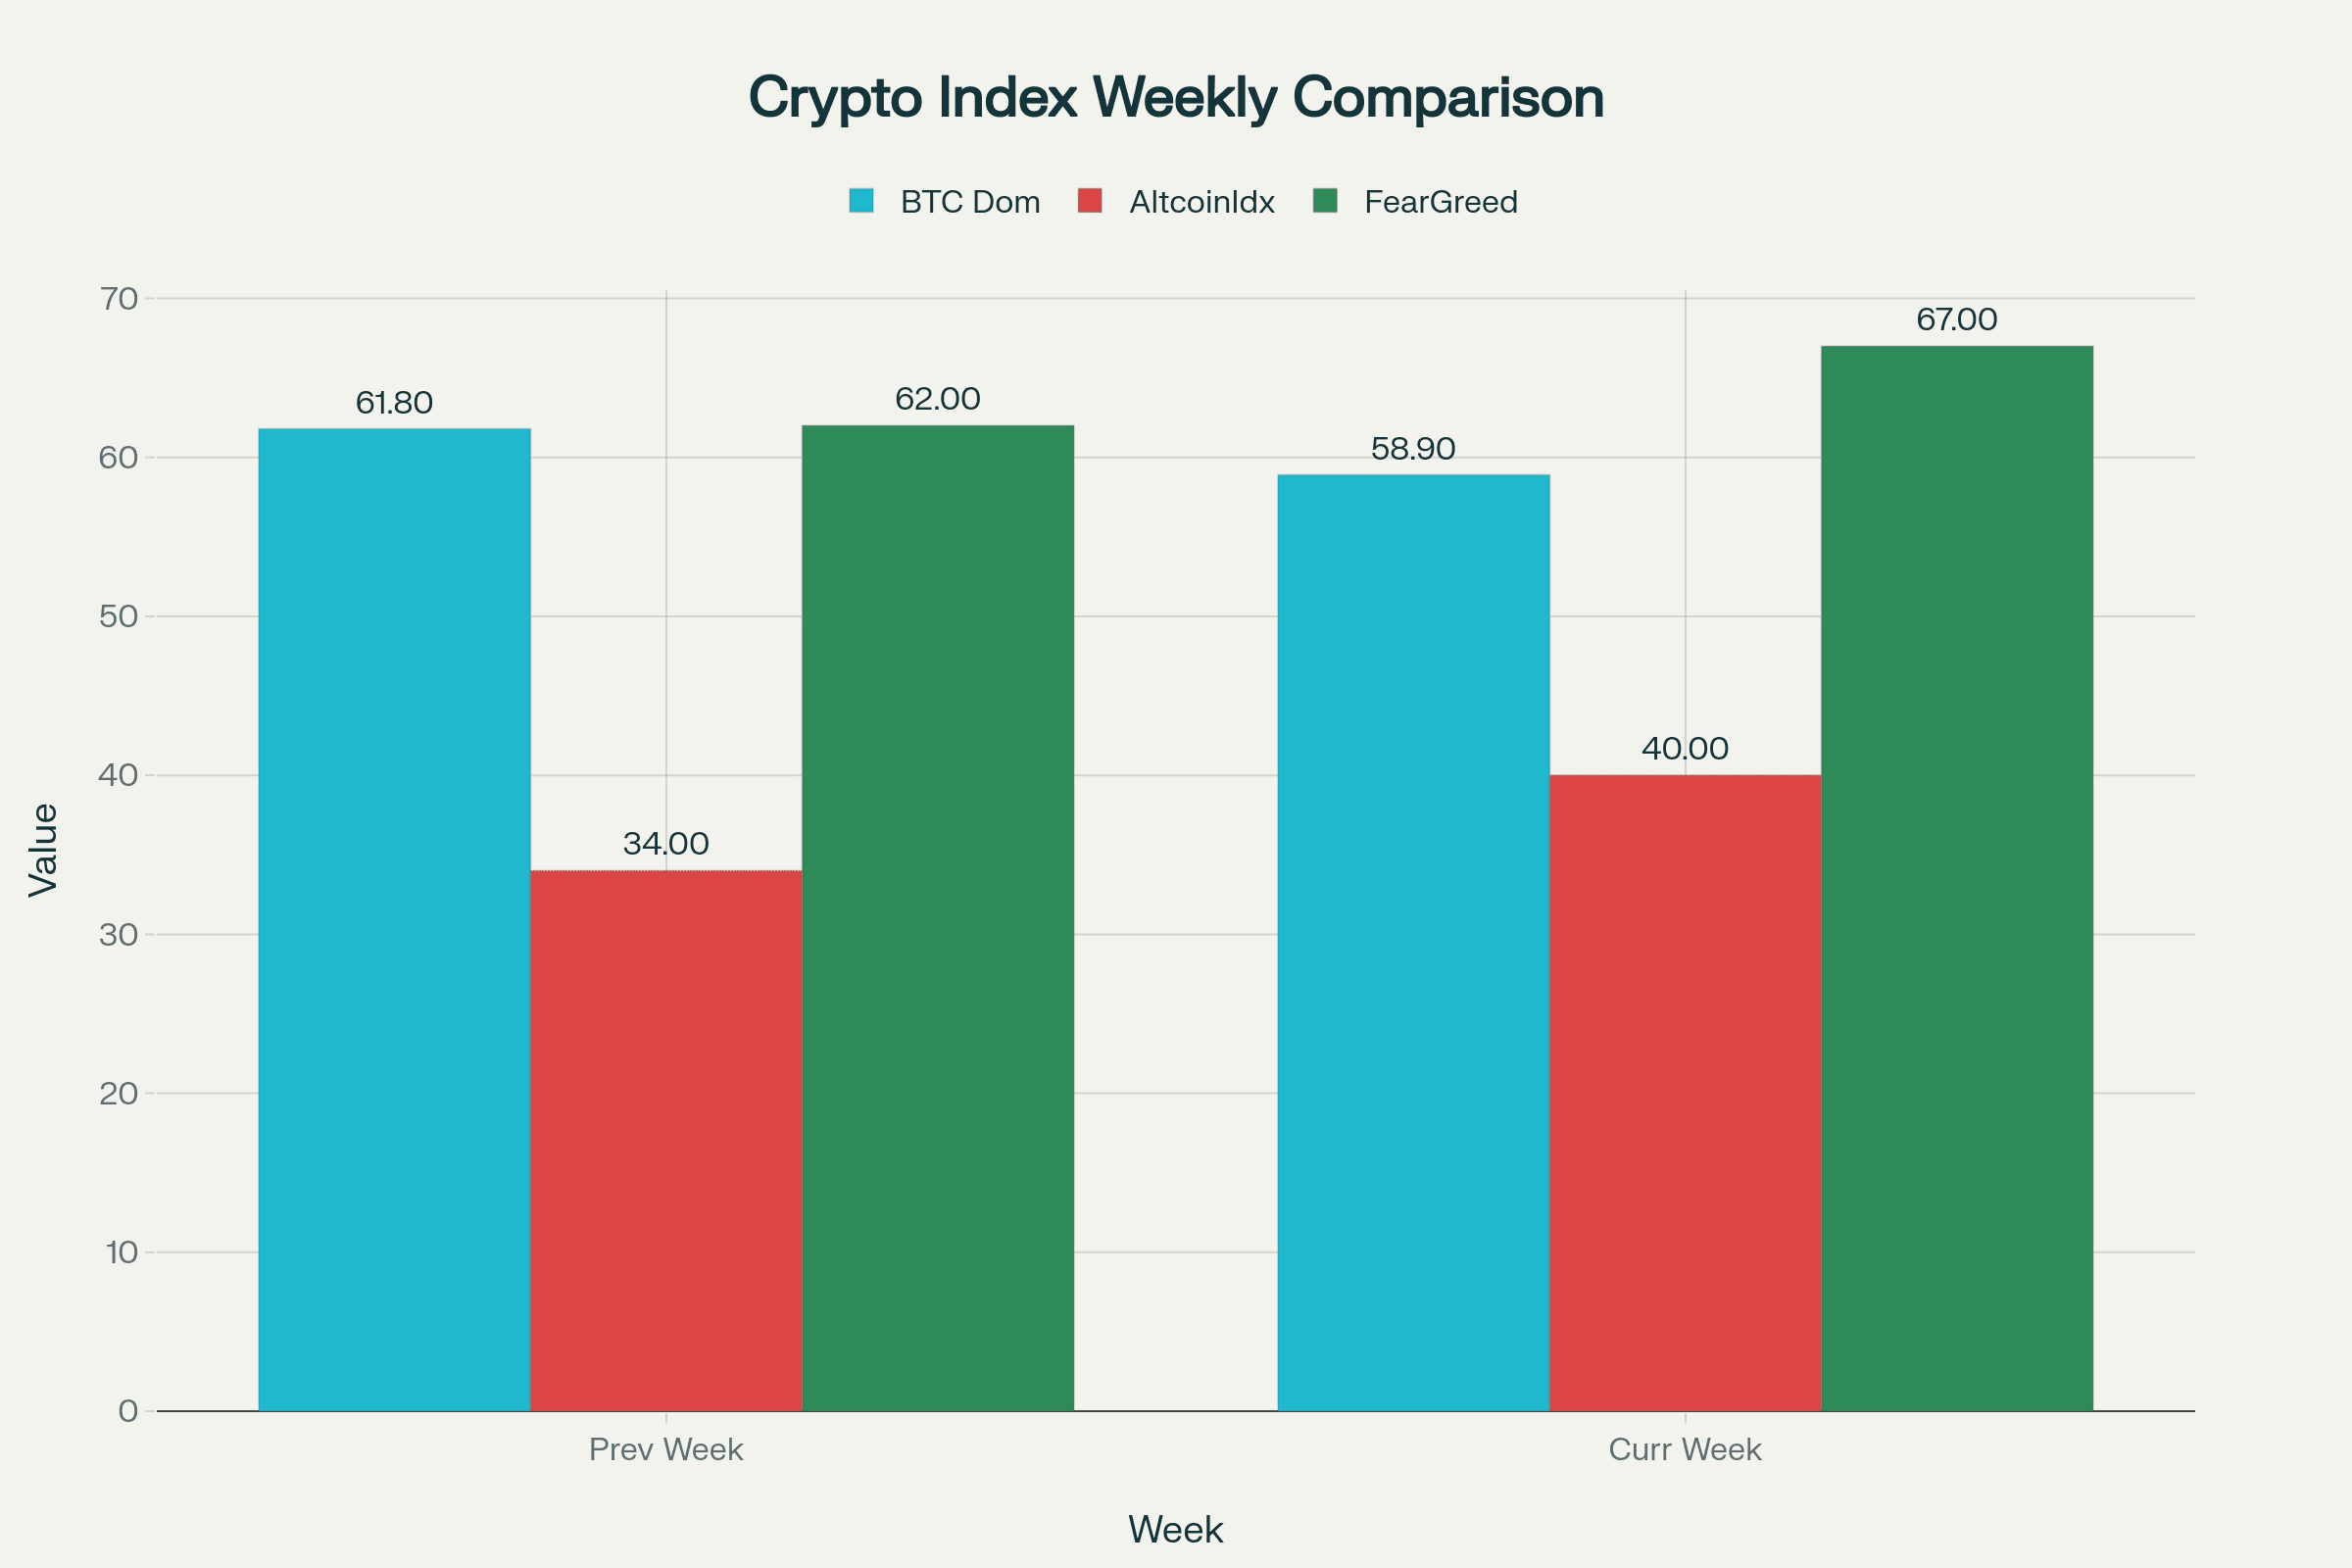
Market sentiment: The decrease in BTC Dominance (59.9%) combined with the increase in the CMC Altcoin Season Index (40) indicates that market sentiment is shifting from a BTC-dominated risk-averse state to a moderately optimistic stance towards altcoins. The Crypto Fear and Greed Index (67) shows that the market is in a greedy state, close to overheating, but has not yet reached historical peak levels, suggesting there is still room for growth.
User Behavior: Investor behavior shows divergence: some funds flow into altcoins (such as ETH, XRP), reflecting an increase in risk appetite; however, the net outflow on the BTC chain and long-term holders accumulating indicate that core investors remain optimistic about BTC, preferring to hold rather than sell. Discussions on platform X are active, with the popularity of topics #Bitcoin and #AltcoinSeason rising, and FOMO sentiment driving an increase in trading volume (daily average of $3.3 billion, CMC).
BTC Dominance
Description: Measures the proportion of BTC market capitalization to total cryptocurrency market capitalization, reflecting the allocation of funds between BTC and altcoins. High values (>60%) typically indicate a market leaning towards BTC, with investors tending to seek safety; low values (<50%) suggest active altcoins, with an increase in risk appetite.
Changes in the past week (as of August 14, 2025): decreased from 61.8% to 58.9% (CoinMarketCap). A weekly decline of about 1.9%, the largest single-week drop in nearly a month.
CMC Altcoin Season Index
Description: Based on the performance of the top 100 cryptocurrencies (excluding stablecoins and wrapped tokens) relative to BTC over the past 90 days, it measures whether the market is in 'Altcoin Season'. An index >75 indicates Altcoin Season, <25 indicates Bitcoin Season.
Changes in the past week: increased from 34 to 40 (CMC, @Phil96969696). An increase of 6 points over the week, but still within the 'Bitcoin Season' range.
Crypto Fear and Greed Index
Description: A comprehensive assessment of market sentiment based on volatility, trading volume, social media sentiment, surveys, BTC Dominance, and Google Trends, with a range of 0-100 (0 = extreme fear, 100 = extreme greed).
Changes in the past week: increased from 62 (Greed) to 67 (Greed) (Alternative.me). An increase of 5 points over the week, close to the 'extreme greed' edge (>75).
VI. Risk Point Monitoring
Technical Risks: If Bitcoin fails to effectively hold above $123,218 after breaking through $123,000, it may form a double top pattern, triggering a pullback to test key support levels, including $119,383 and lower at $111,920.
Macro and Policy Risks: There is uncertainty regarding the progress of trade negotiations between the U.S. and Europe, cross-border regulatory policies, and the legislative outcomes related to 'Crypto Week', which may trigger regulatory fluctuations.
Market Sentiment Risks: High levels present short-term profit-taking pressure, and the potential concentration of short positions may lead to amplified price fluctuations in the short term.
VII. Future Outlook and Strategy Recommendations
Turing M combines multiple on-chain and market data to predict that Bitcoin is expected to maintain a steady upward trend in the short term. Based on the current scale of incoming funds and market depth, it is expected that Bitcoin's price could reach the range of $125,000 to $133,300 by the end of August. In the long term, the continuous positioning of institutions and the trend of supply-side scarcity will support higher price levels, with Cathie Wood predicting it will exceed $1 million within five years, and BitBull optimistic that it will reach $150,000 by the second quarter of 2026.
Regarding strategy recommendations, investors can focus on the following key points:
Use on-chain cost structure analysis to time entry points, combined with bullish preferences in the options market, to participate in swing trading moderately.
Focus on the inflow of stablecoins and ETF fund dynamics, rationally arrange position allocation, and avoid unilateral risks.
Set strict stop losses, beware of failed breakouts or sudden policy changes that could trigger rapid adjustments.
Use social sentiment indicators to assist short-term decision-making, and participate in community activities to enhance information sensitivity.
VIII. Summary
This week, Bitcoin strongly broke through the historical high of $123,000, indicating that the market has entered a new price discovery phase. Glassnode's on-chain data and market sentiment analysis indicate strong institutional positioning, with new funds continuously flowing in, and clear and sustained short-term momentum. At the same time, potential risks cannot be ignored, especially the uncertainties from technical confirmations and policy regulations. Overall, Bitcoin is at a key node in an upward trend, and investors should be data-driven, combined with risk management, to participate orderly in this historic rally.
citation
[1] CME + Glassnode: Bitcoin Insight and Market Trends H1 2025
[2] Bitcoin News Today: Bitcoin Surges Past $120,000, Next Target ...
[3] BTC Next Move: ETF Positioning Shifts, Options Sentiment, and ...
[4] 2025 - Glassnode Docs
[5] A Return to Profitability - Glassnode Insights
[6] Bitcoin Price (BTC) Analysis: Realized Profits Below Previous Highs
[7] Glassnode - On-chain market intelligence
[8] Expect A New Bitcoin Price Rally: Analyst Connects M2 Lag To ...
[9] Coinbase + Glassnode: Charting Crypto Q3 2025
[10] Glassnode Insights - On-Chain Market Intelligence
[11] Not Just Whales—New BTC Holders Drive Latest Market Rally
[12] BTC Market Pulse: Week 33 - Glassnode Insights
[13] Bitcoin USD (BTC-USD) Price History & Historical ... - Yahoo Finance
[14] koinmilyoner on Binance Square
[15] Bitcoin Bounces Back This Week, But Glassnode Sees Trouble Ahead
[16] Stablecoins' role in crypto and beyond: functions, risks and policy
[17] XPO
[18] BTC Market Pulse: Week 31 - Glassnode Insights
[19] CryptoPotato - Bitcoin & Altcoins, Crypto News and Guides
[20] News - Cointribune


