Chainlink (LINK) has become the focal point of the cryptocurrency market in the past 24 hours, recording an impressive breakout of 13% on Sunday. This recovery has also spread to many other altcoins like Arbitrum (ARB) and MemeCore (M), adding vibrancy to the market. However, technical signals still indicate a tug-of-war, as most altcoins struggle to maintain and extend their upward moves on Monday morning.
Chainlink attracts attention as LINK reserves increase
The recovery of Chainlink (LINK) is being bolstered by the announcement of the LINK reserve fund, which stimulates demand while restricting supply through buyback programs. As of Monday, the fund holds 109,663 tokens, providing additional support for the bullish trend.
After hitting a peak of $26.50, LINK slightly corrected to $25.66 on Monday afternoon, facing the risk of losing the acceleration gains from last weekend. However, if it maintains the upward momentum and closes above the resistance level of $26.68, LINK will record its highest close since the beginning of 2025. For investors still on the sidelines, this could be an opportunity to 'catch the trend,' with a target towards the important psychological milestone of $30.
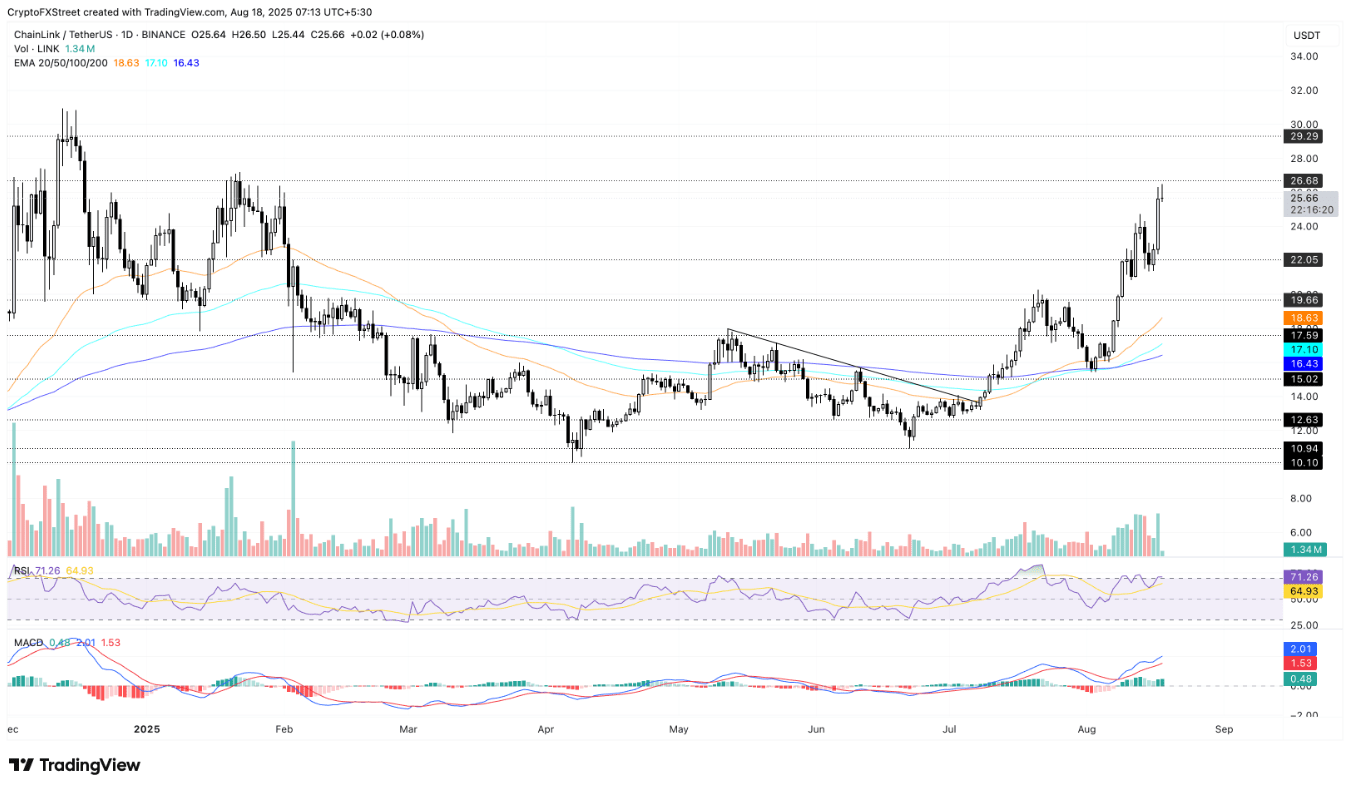
Technical signals are currently quite positive: the MACD line and the signal line of the MACD indicator continue to expand the upward trend, reinforcing upward momentum. Meanwhile, the RSI has climbed to 71 and is oscillating around the overbought region, signaling a risk of reversal as buying pressure begins to stabilize.
In the event of a correction, LINK has the potential to revisit the support level of $22.05 – a price that was previously tested in Saturday's trading session.
Arbitrum could enter a consolidation phase
Arbitrum (ARB) fell more than 1% on Monday afternoon, after a strong increase of 8.87% on Sunday. The decline reflects profit-taking pressure around the resistance area of $0.5712 – the closing level recorded last Wednesday.
ARB continues to accumulate with a lower bound at $0.4842, also tested on Saturday. If this level is broken, the price may retreat to the 200-day exponential moving average (EMA) at $0.4437.
Notably, the 50-day EMA is approaching the 200-day EMA, opening up the possibility of forming a golden cross. This could be a buy signal for investors waiting, as the short-term trend shows signs of recovery.
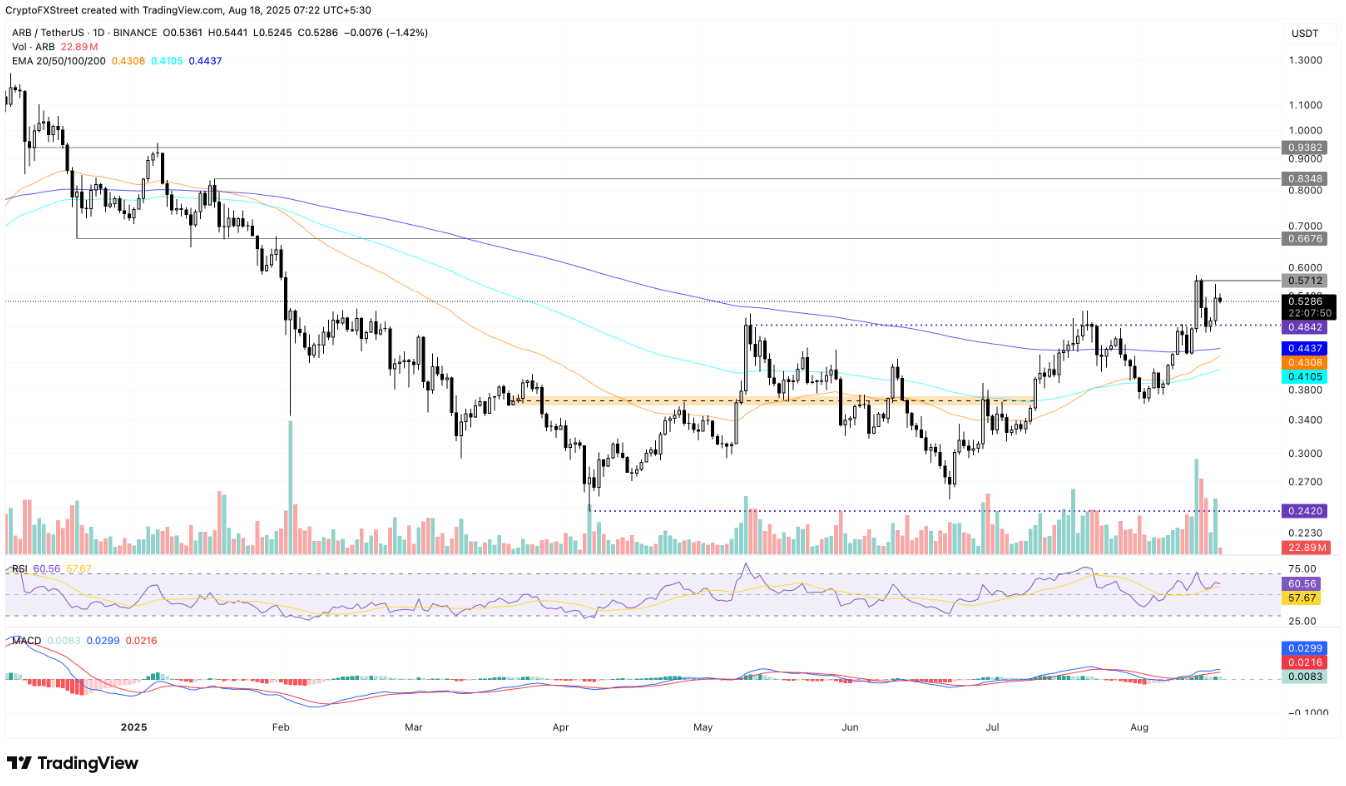
On the daily chart, the RSI is at 60 and trending down, reflecting weakening buying pressure. Nevertheless, the MACD still shows that upward momentum is being maintained.
On the upside, a close above $0.5712 could extend the upward trend to $0.6676 – a price level last tested on January 31.
MemeCore tests dynamic support after breakout
MemeCore (M) has just broken out of a descending wedge pattern on the 4-hour chart and is currently testing the 50-period EMA at $0.4351, while maintaining above the important dynamic support area.
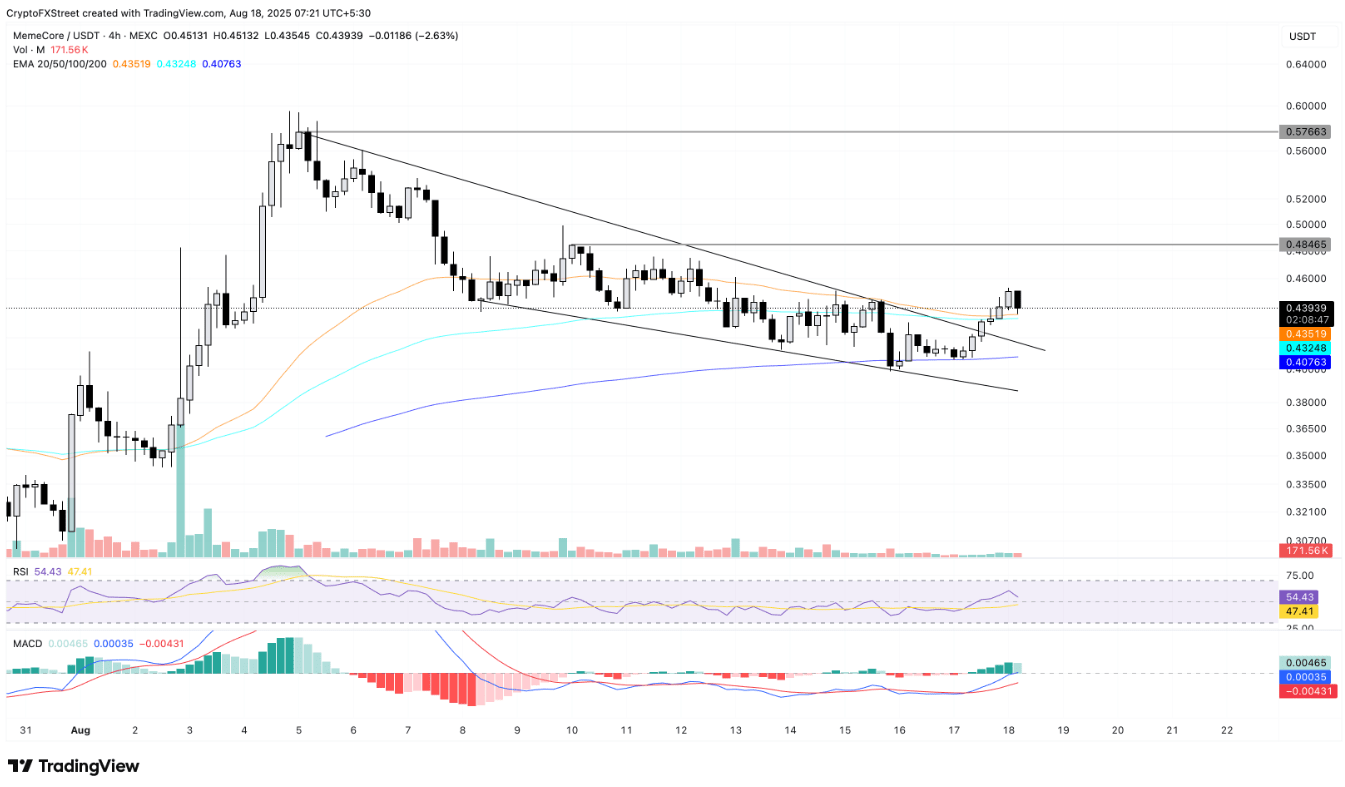
If the 4-hour candle continues to close firmly above the 50-period EMA, the uptrend could extend to the $0.4846 mark. Momentum indicators are also supporting this trend: the RSI has risen above 54 and crossed the signal line, while the MACD and signal line are approaching the 0 axis, signaling increasing buying pressure.
However, on the flip side, a clear close below the 50-period EMA could trigger a correction, bringing the price back to the old resistance area around $0.4000.