Bitcoin has corrected nearly 8% since reaching a record high of over $124,400 four days ago. Currently, this coin faces the risk of a deeper decline due to a classic bearish reversal pattern.
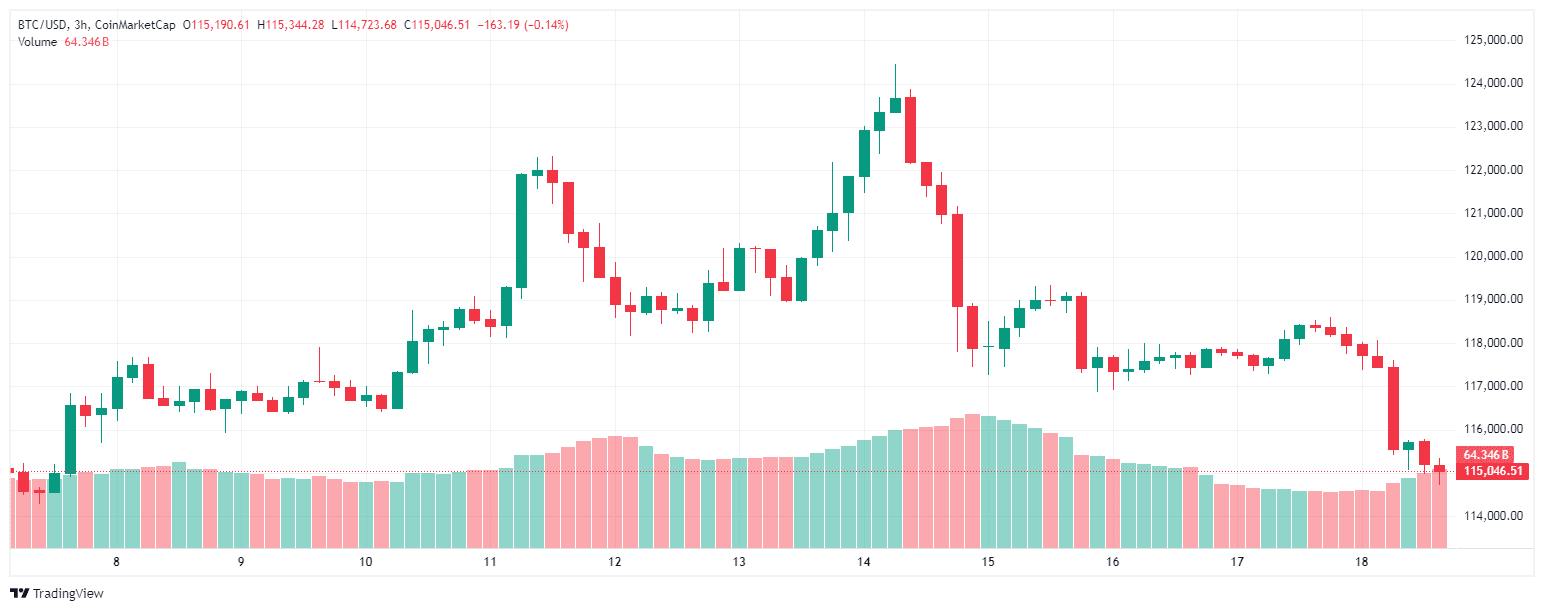
Bitcoin could fall below $100,000.
According to analysis by expert Captain Faibik, Bitcoin has confirmed a breakout of the ascending wedge on the daily chart.
In traditional analysis, the ascending wedge pattern is often seen as a bearish reversal structure, signaling a downturn, especially after a prolonged upward trend. With Bitcoin, this pattern has formed since April, as higher highs and higher lows gradually converge towards the wedge top.
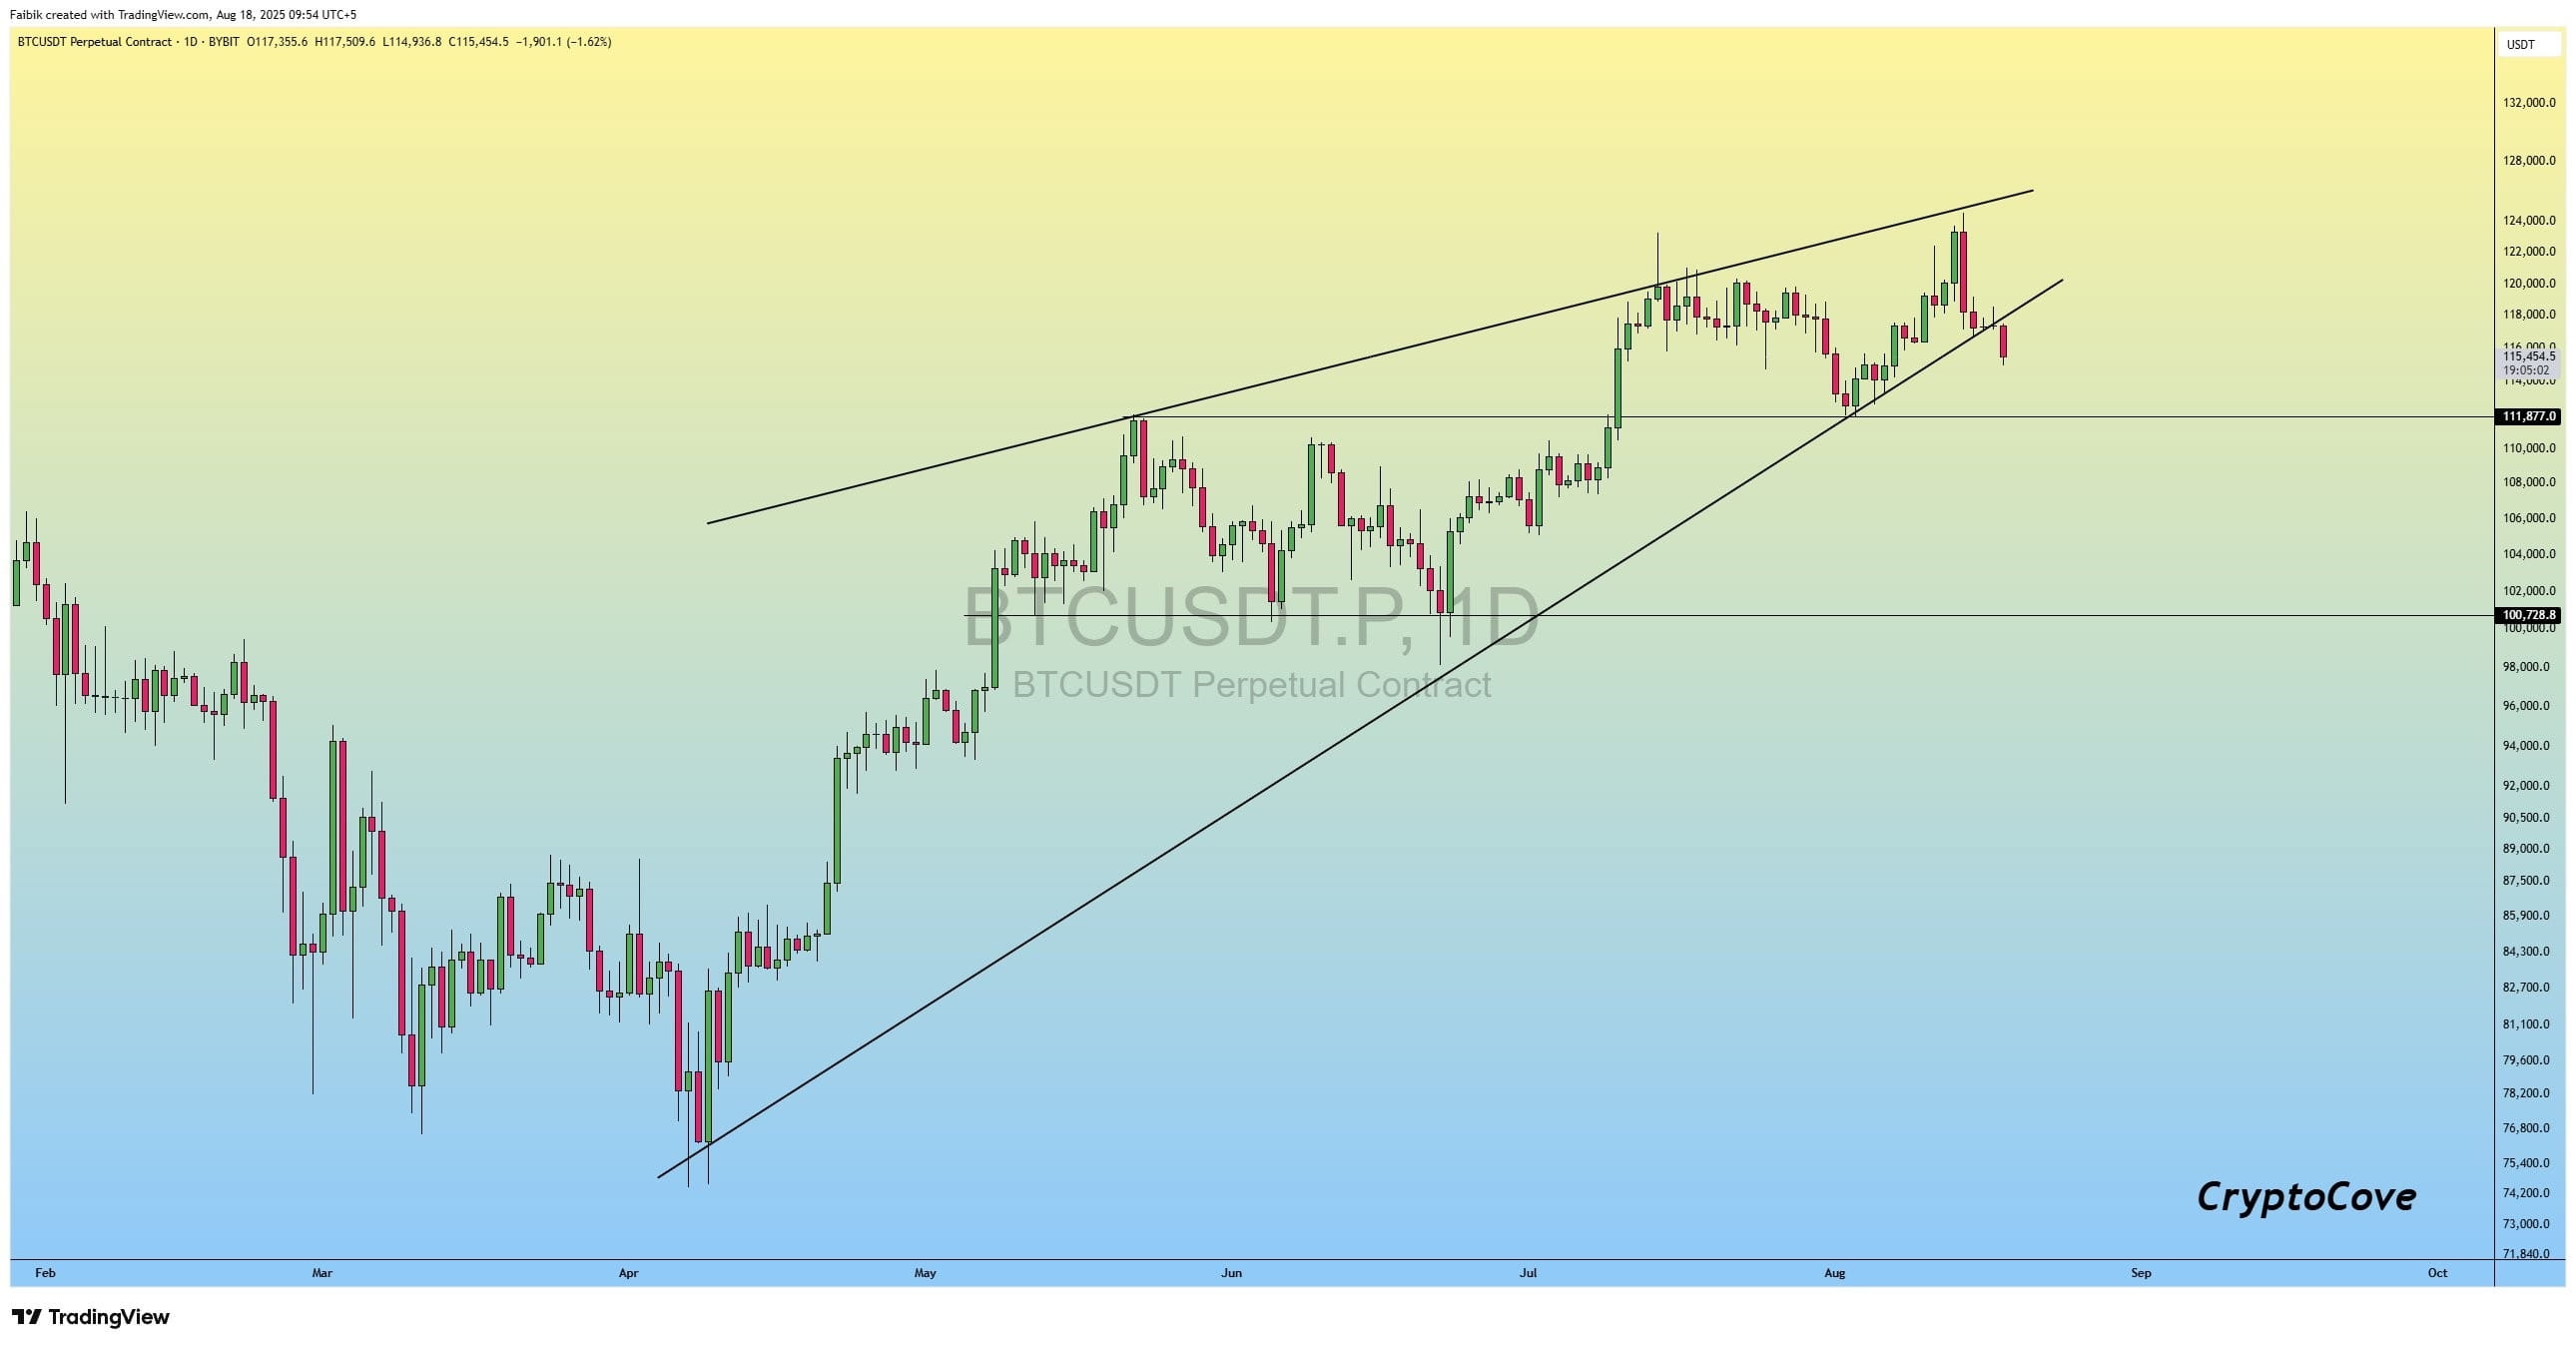
According to expert analysis, prices breaking below the support trendline of the wedge indicate that Bitcoin will test recent resistance areas that have turned into support, signaling weakening upward momentum and increasing selling pressure.
They emphasize that the nearest support zone is at $110,000–$112,000. If this area is lost, BTC could pave the way down to $105,000–$108,000.
In the event of stronger selling pressure, Bitcoin could extend its decline towards the important psychological zone of $98,000–$100,000 in September, equivalent to a 20% correction from its recent peak.
Bitcoin could drop down to $88,000.
The bearish target of the ascending wedge pattern is usually measured by subtracting the maximum height of the pattern from the breakout point. Applying this method to the Bitcoin chart, the deep bearish target could drop to $88,000, as illustrated below.
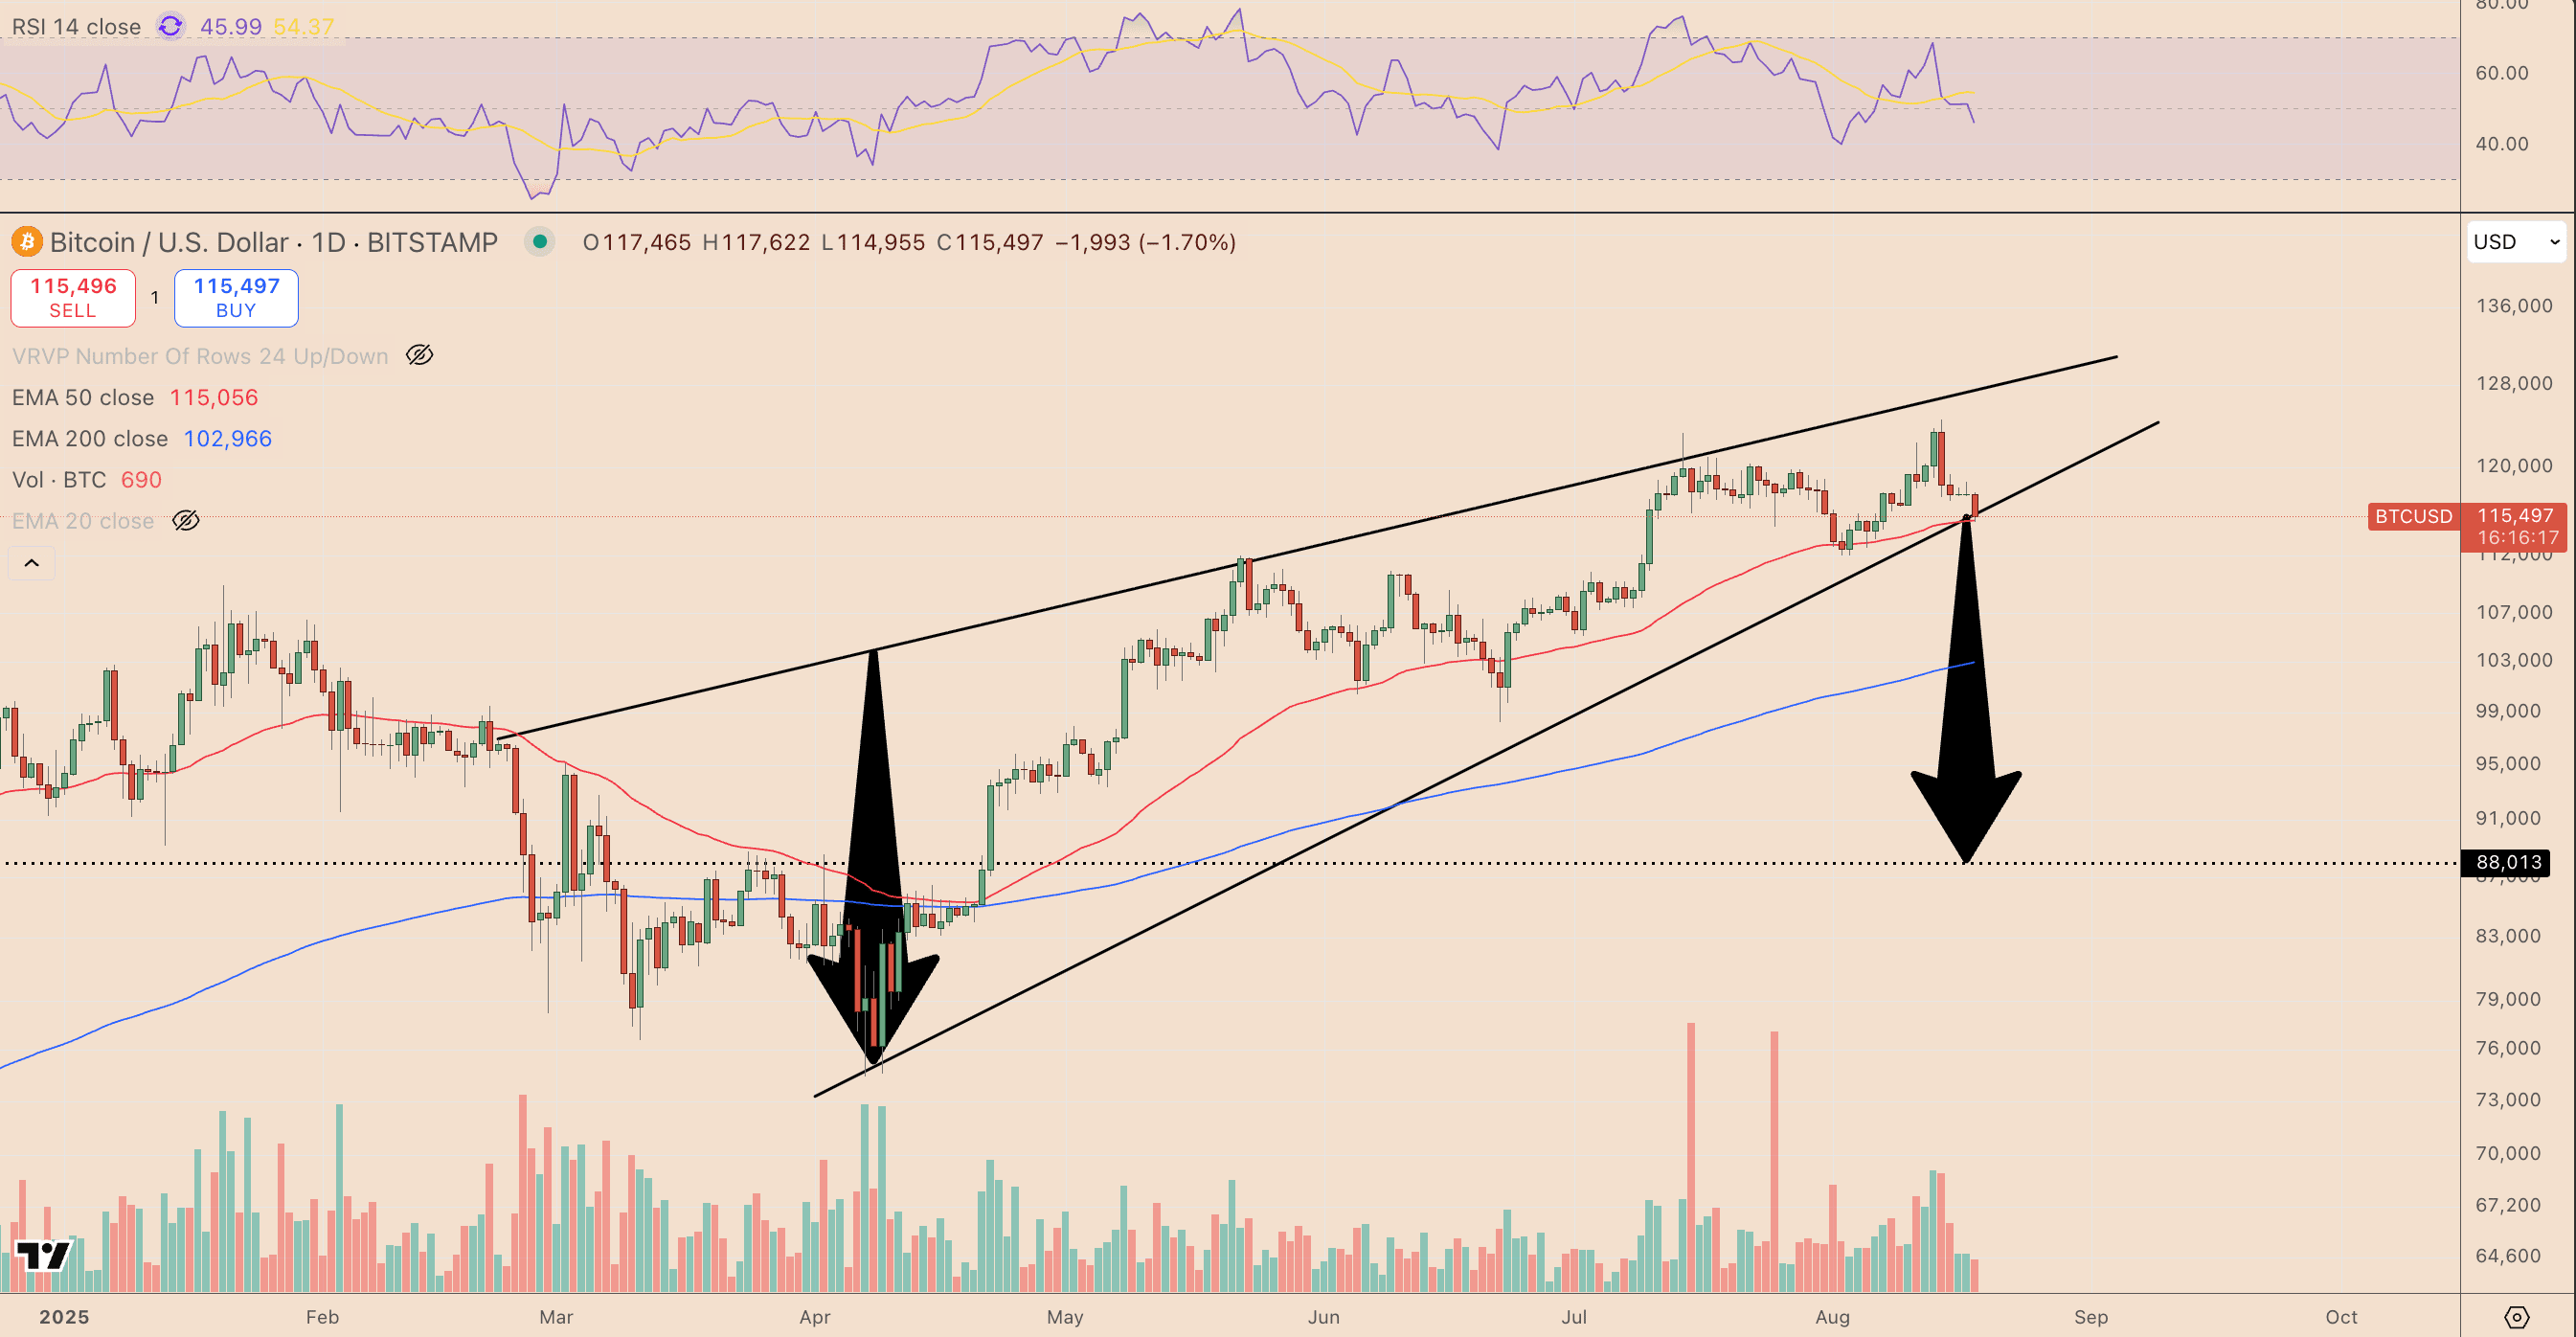
The bearish scenario would be invalidated if Bitcoin holds above the 50-day exponential moving average (EMA) – a strong support zone that has supported BTC throughout the more than 50% rise since April.
In this case, prices are likely to recover back to the upper trendline of the wedge, around $125,000 in September.
The double top pattern scenario suggests a level of $94,750.
The weekly candle close of Bitcoin indicates a potential double top formation, similar to 2021 – a bearish reversal pattern characterized by consecutive tops at the same price range, signaling weakening upward momentum.
In 2021, this pattern paved the way for a strong correction of 77%, as BTC fell from around $69,000 to below $16,000 in just a few months afterwards.
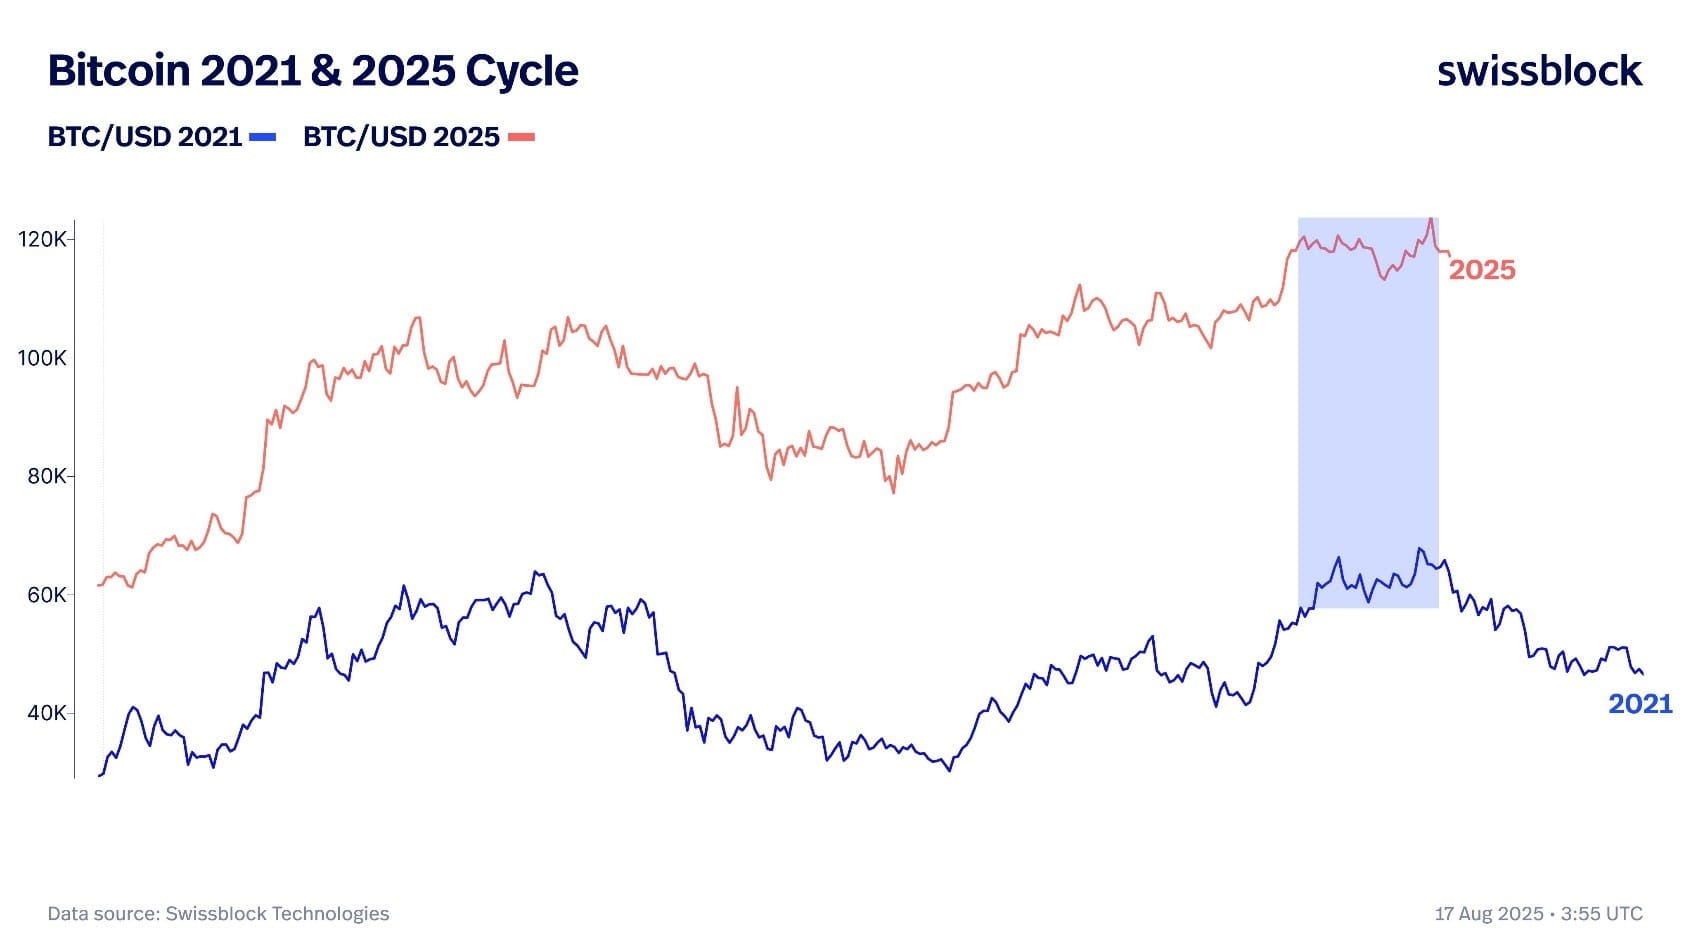
The current similar setup is increasing short-term downside risks unless prices reverse quickly, according to Swissblock's analysis.
If the double top scenario occurs similarly to 2021, Bitcoin risks falling to the 50-day EMA (red line) around $94,750 in September.
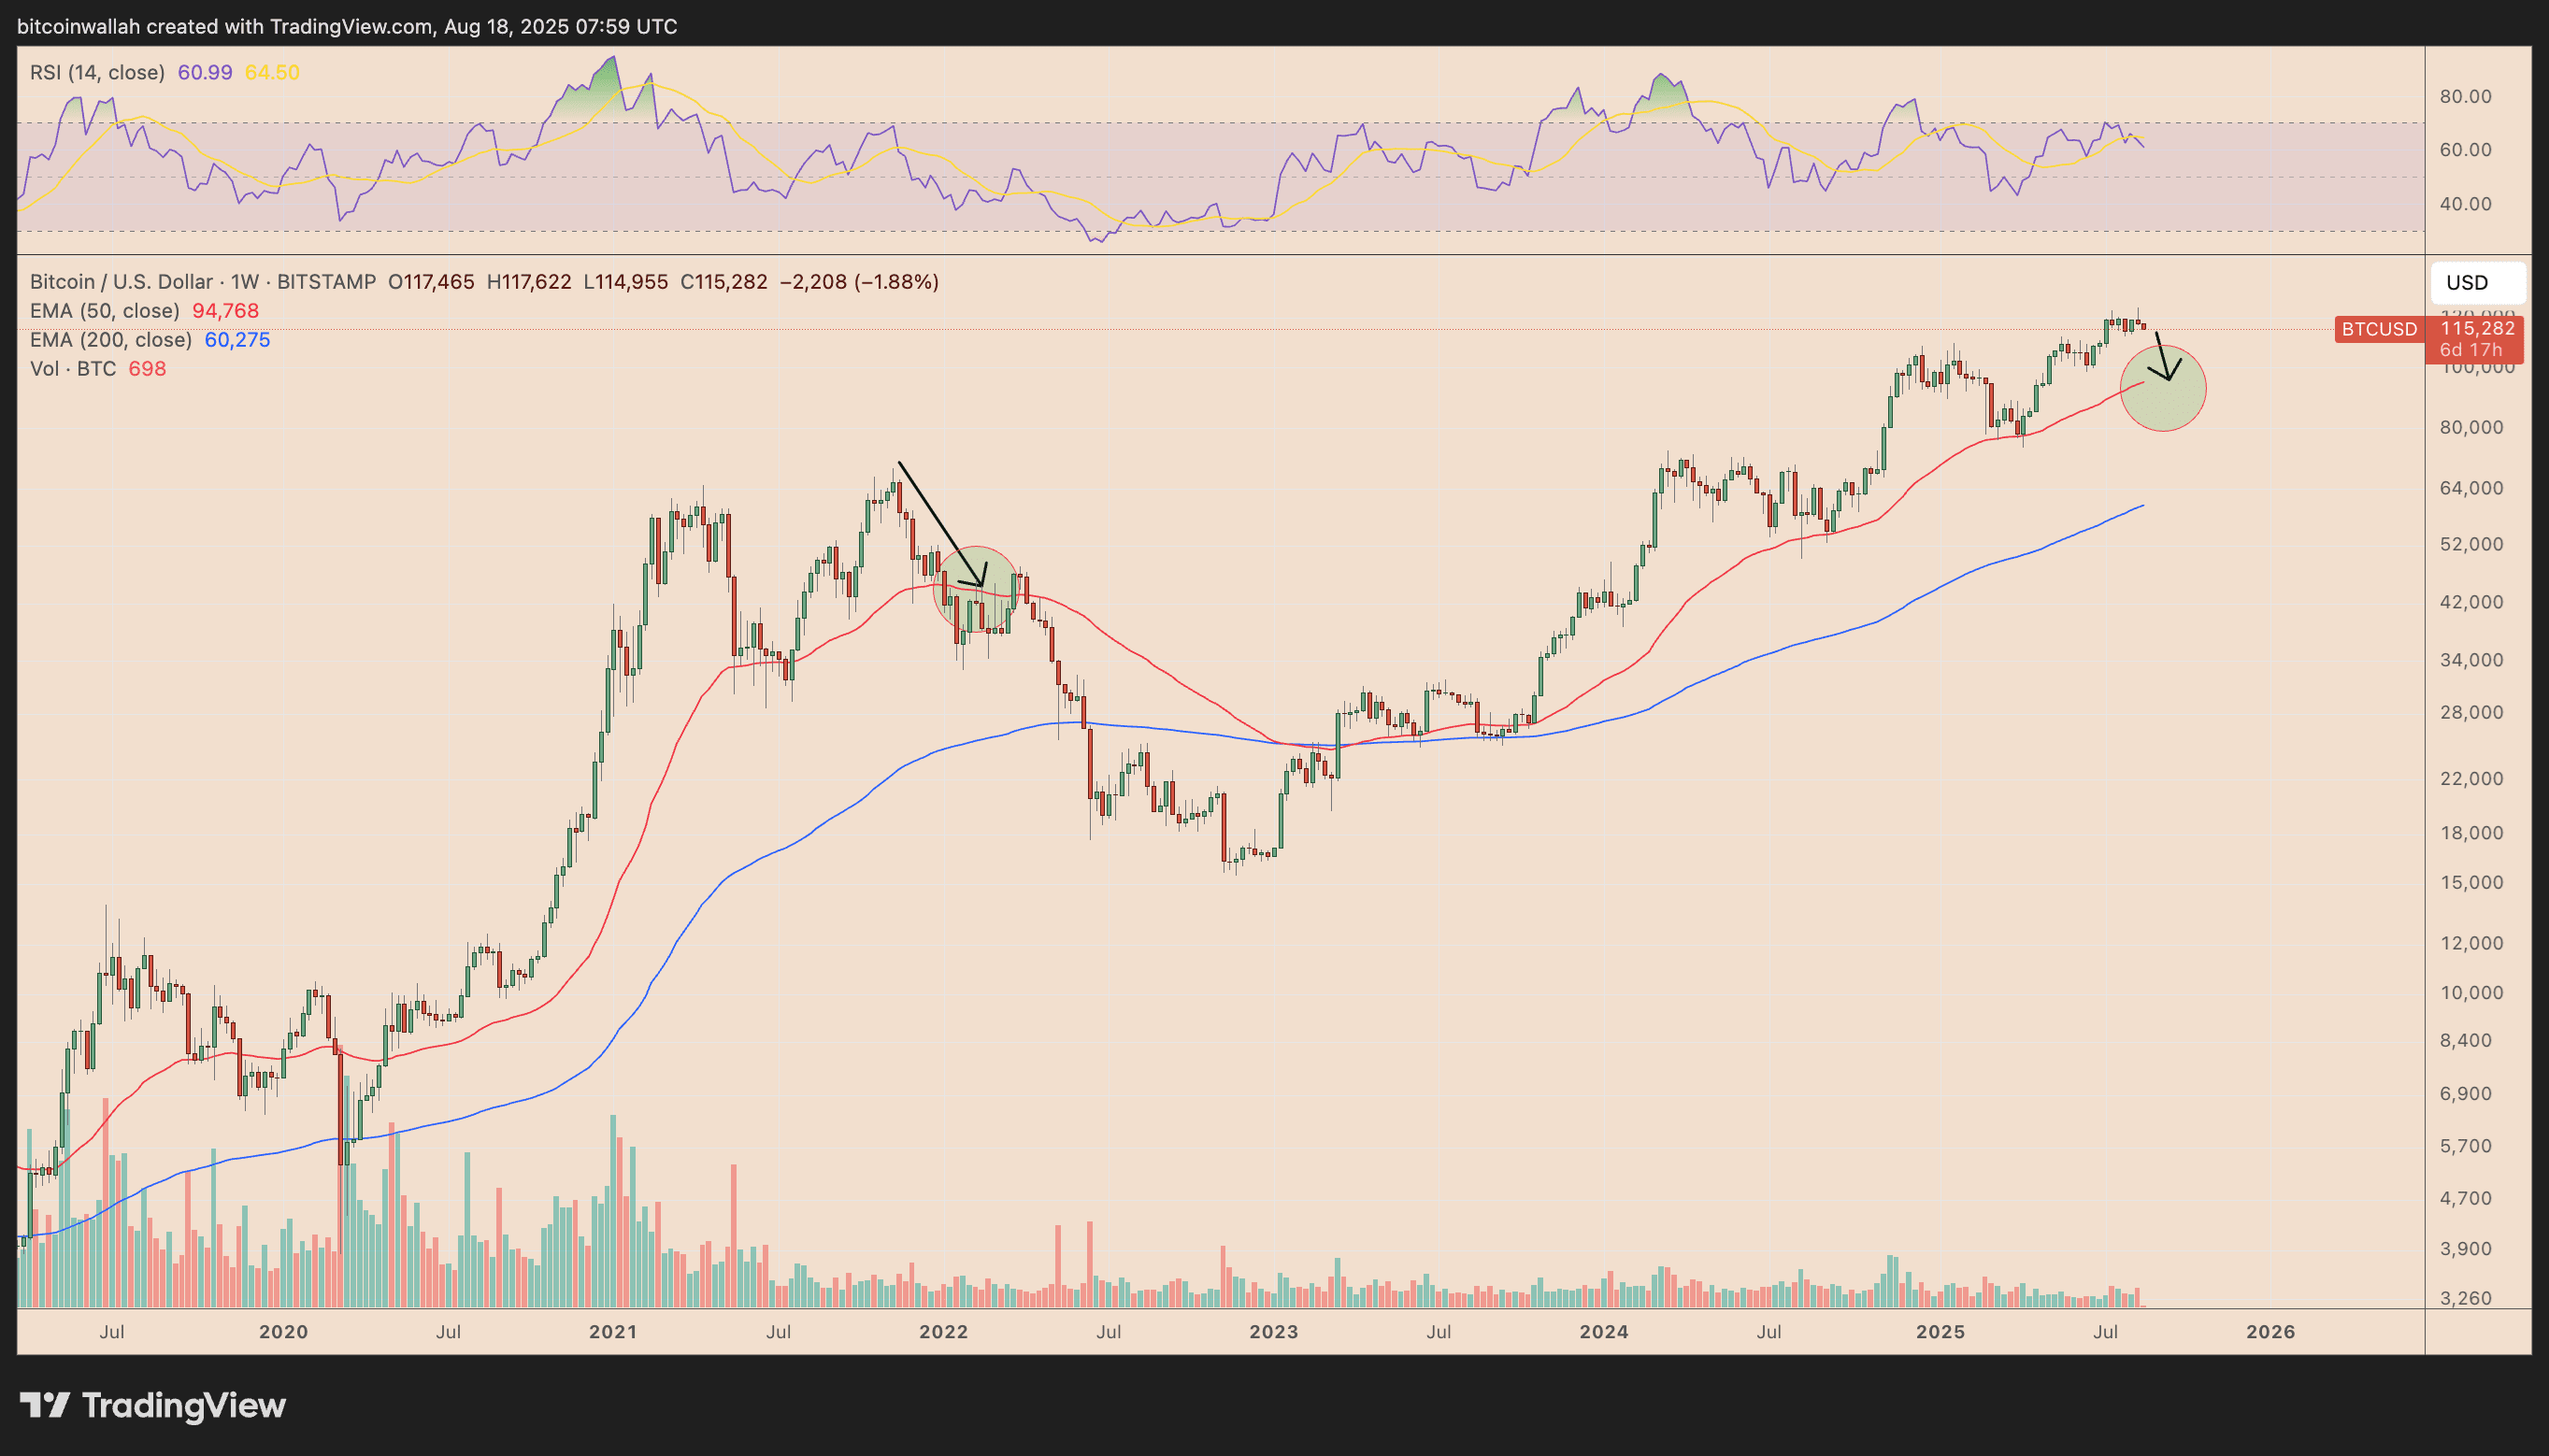
The 50-week EMA has served as a strong accumulation zone since June 2023.
Large investor groups are liquidating Bitcoin.
Bitcoin's on-chain indicators further increase the risk of prices continuing to decline in the coming weeks.
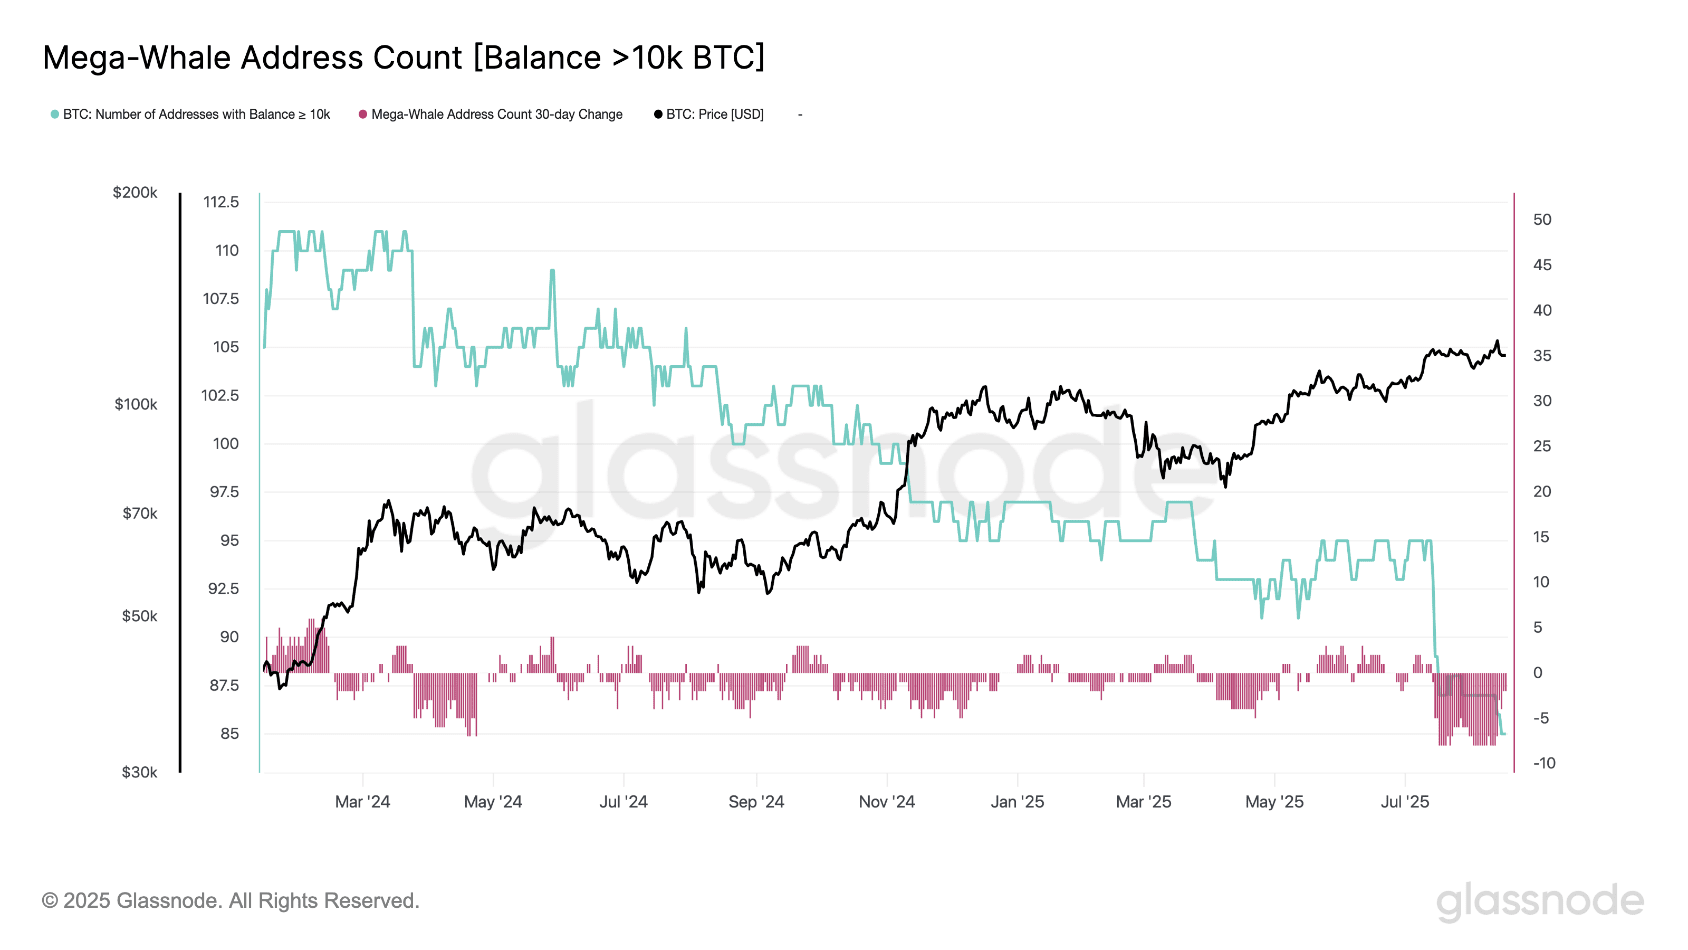
The number of large whale addresses holding more than 10,000 BTC has dropped to its lowest level this year, with continuous negative volatility for 30 days since mid-July, according to data from Glassnode.
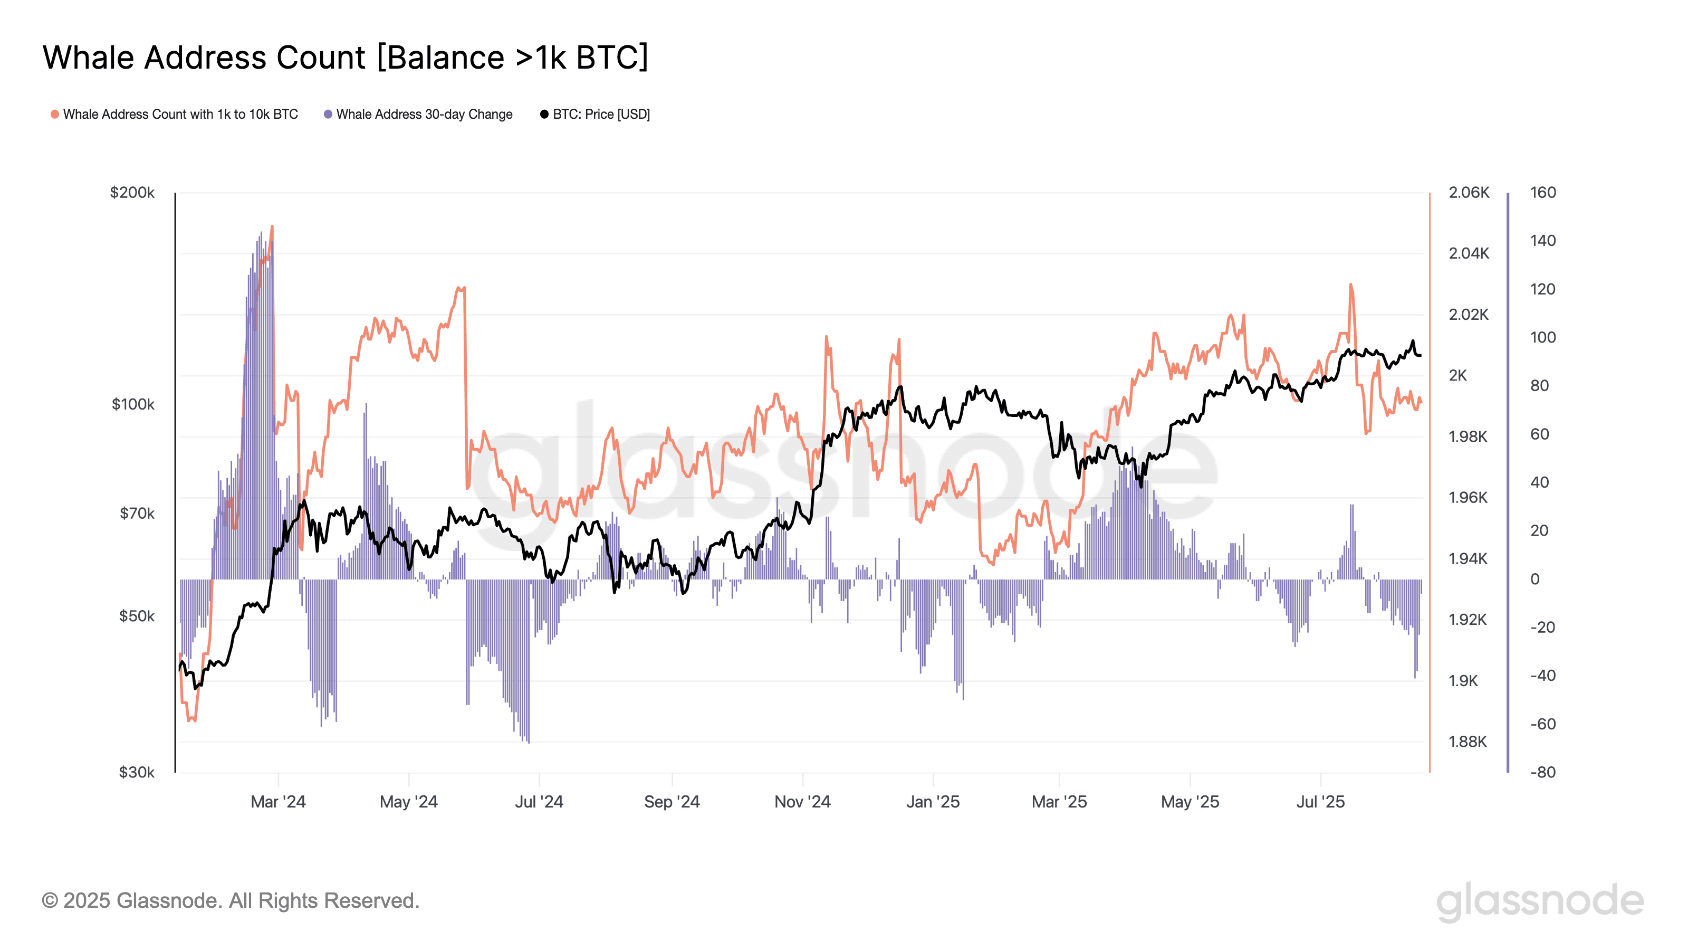
Whale wallets holding between 1,000 and 10,000 BTC have also decreased, reflecting profit-taking activity near Bitcoin's recent price peaks.
Combined with the breakout of the ascending wedge pattern and weakening technical indicators, selling pressure from whales increases the risk of a broader correction unless market buying demand truly strengthens.
The Fed's potential interest rate cuts could reduce downside risks.
There is another significant difference between the BTC price cycle of 2021 and the current one.
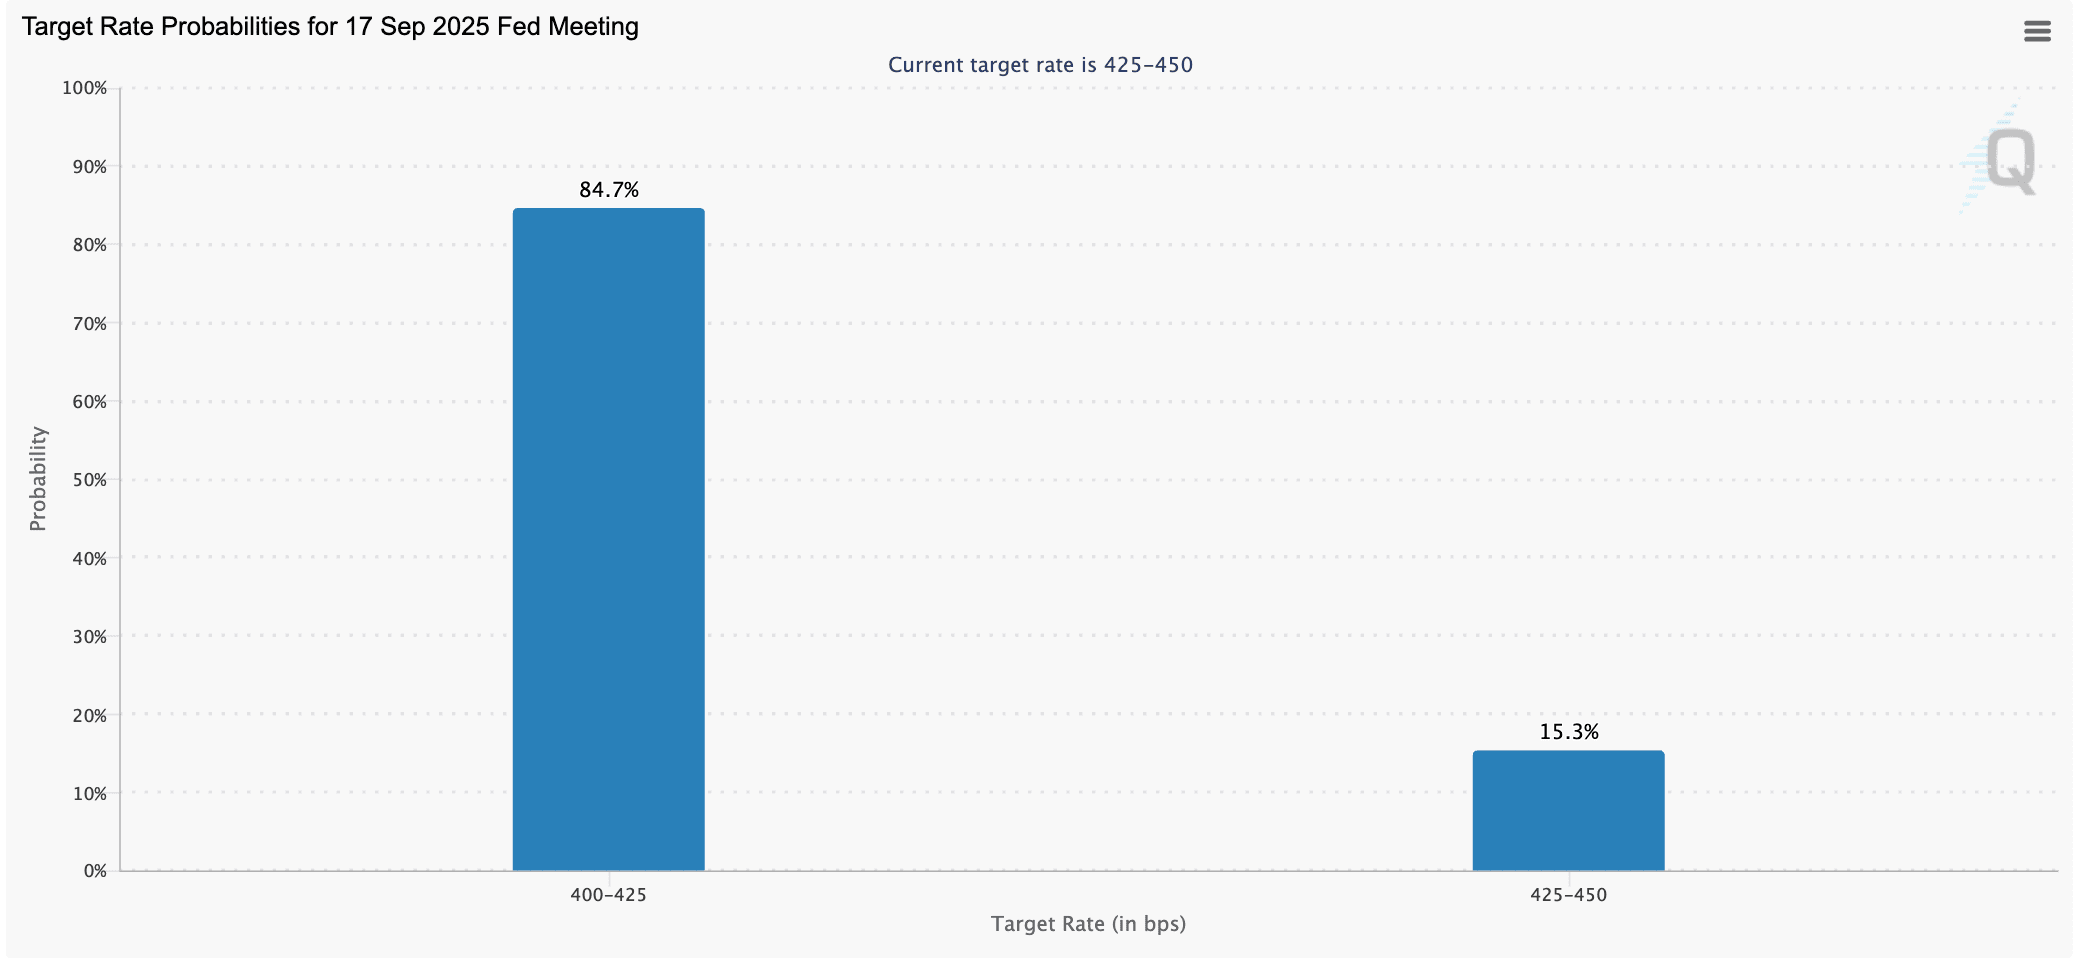
In 2021, Bitcoin peaked right as the U.S. Federal Reserve (Fed) began to taper asset purchases and shift towards quantitative tightening. This time, according to data from CME, the likelihood of the Fed cutting interest rates by 25 basis points (bps) in September is high.
Additionally, the global money supply (M2) continues to rise, suggesting a price target of $132,000 for Bitcoin in the coming months. Some predictions even suggest that BTC could reach $170,000.
According to Swissblock's comments, this liquidity shift may rebalance short-term technical weaknesses, helping to maintain BTC's broader upward trend.
