$SOL Based on the images you have provided, which show the SOL/USDT trading pair on the Binance platform at 10:46 PM (Costa Rica time, since you indicated that the location is Alajuelita, San José Province, Costa Rica), I can give you the following real-time analysis:
SOL/USDT Market Analysis:
* Current price: The price of Solana (SOL) is approximately 182.63 USDT. In another image, a price of 182.70 USDT and 182.58 USDT is shown, which indicates that the price is in a very volatile range and fluctuating rapidly.
* Trading volume: The 24-hour volume for SOL is 2.98 million units, while the 24-hour volume for USDT is 566.57 million.
* 24-hour Change: The price has experienced a drop of 5.27% in the last 24 hours.
* 24-hour Range: The maximum price in the last 24 hours has been 195.89 USDT and the minimum of 181.57 USDT.
Technical analysis (indicators):
* RSI(6): The Relative Strength Index (RSI) in a period of 6 hours is 23.17. An RSI value below 30 is often considered a sign that the asset is in an oversold condition, which could indicate a possible price rebound in the short term, although it is not a guarantee.
* MACD: The values of the MACD (Moving Average Convergence/Divergence) are as follows:
* DIF: 0.06
* DEA: 0.14
* MACD: -0.08
* The MACD value is negative, which suggests a short-term bearish trend. The DIF (MACD) line is below the DEA (Signal) line, which is also a sign of bearish momentum.
Order Book:
* Demand (Buy) vs. Supply (Sell):
* Total demand (buy) is shown in green and total supply (sell) in red.
* Total demand is 57.80% and total supply is 42.20%. This indicates that there is more buying pressure than selling pressure at this time, which could lead to a price increase, despite the general bearish trend.
* Order book detail:
* It can be seen that there are large volumes of buy orders at prices slightly lower than the current one, for example, at 182.60 and 182.59 USDT. This suggests that there is buying support at those levels.
* Significant volumes of sell orders are also observed at higher prices, for example, at 182.66 and 182.67 USDT, which indicates resistance at those levels.
Recent Transaction History (Book):
* The most recent transaction history shows buy and sell operations in a very tight price range, from 182.53 to 182.61 USDT, which confirms the volatility and price action in a narrow range. Most of the most recent transactions are in the 182.5X and 182.6X range.
General summary:
At this time, the price of SOL/USDT is experiencing a sharp bearish correction in the last 24 hours (-5.27%). However, RSI indicators suggest an oversold condition, which could indicate an imminent rebound. The order book shows more buying pressure than selling, which reinforces the idea of a possible short-term rebound. However, the general trend remains bearish according to the MACD.
Important: This information is based on the screenshots that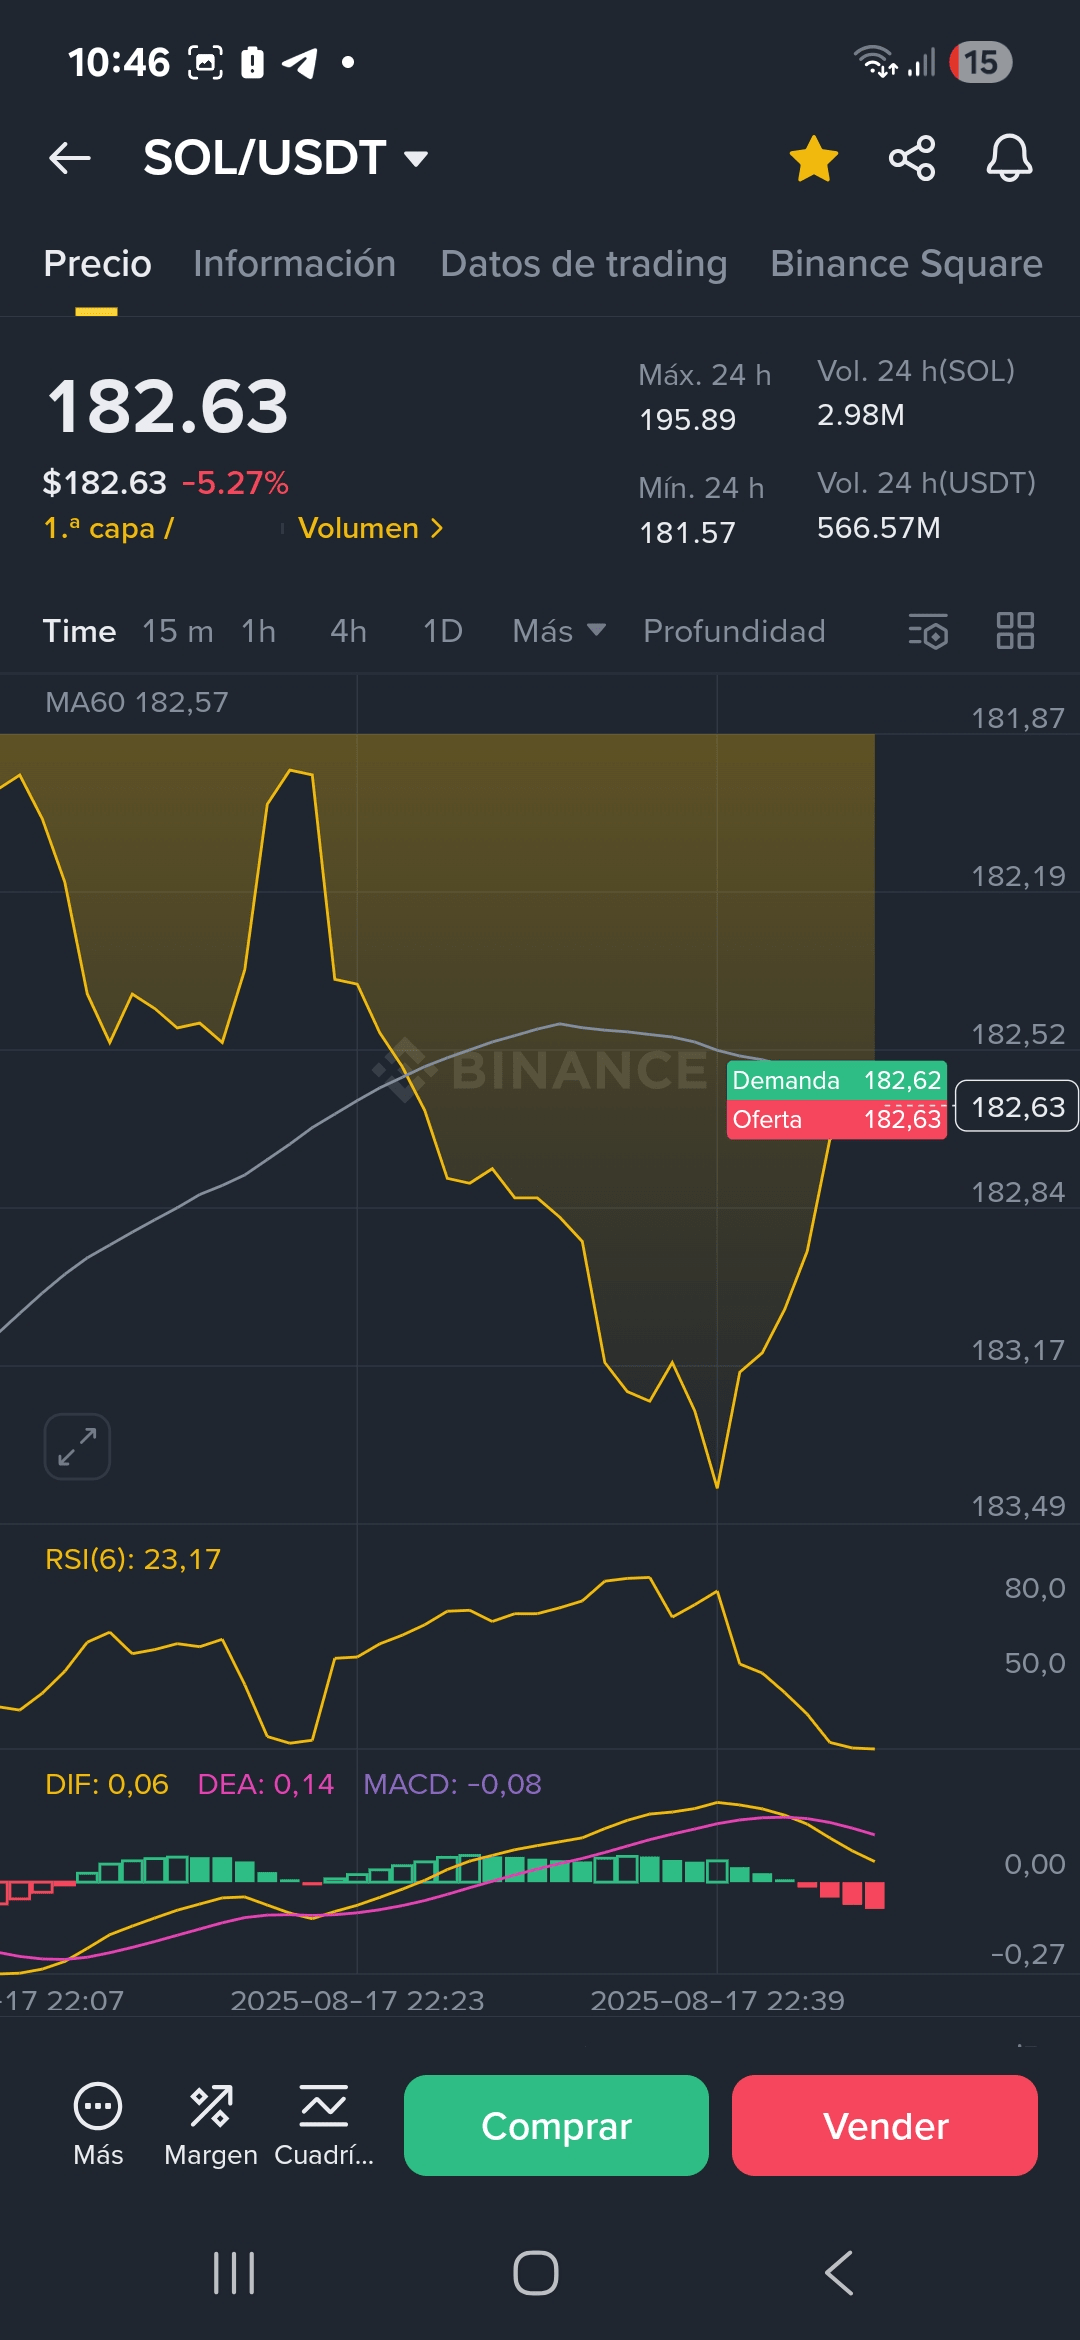 you have provided and is not investment advice. The cryptocurrency market is extremely volatile and prices can change in a matter of seconds.
#
