What the Charts Reveal
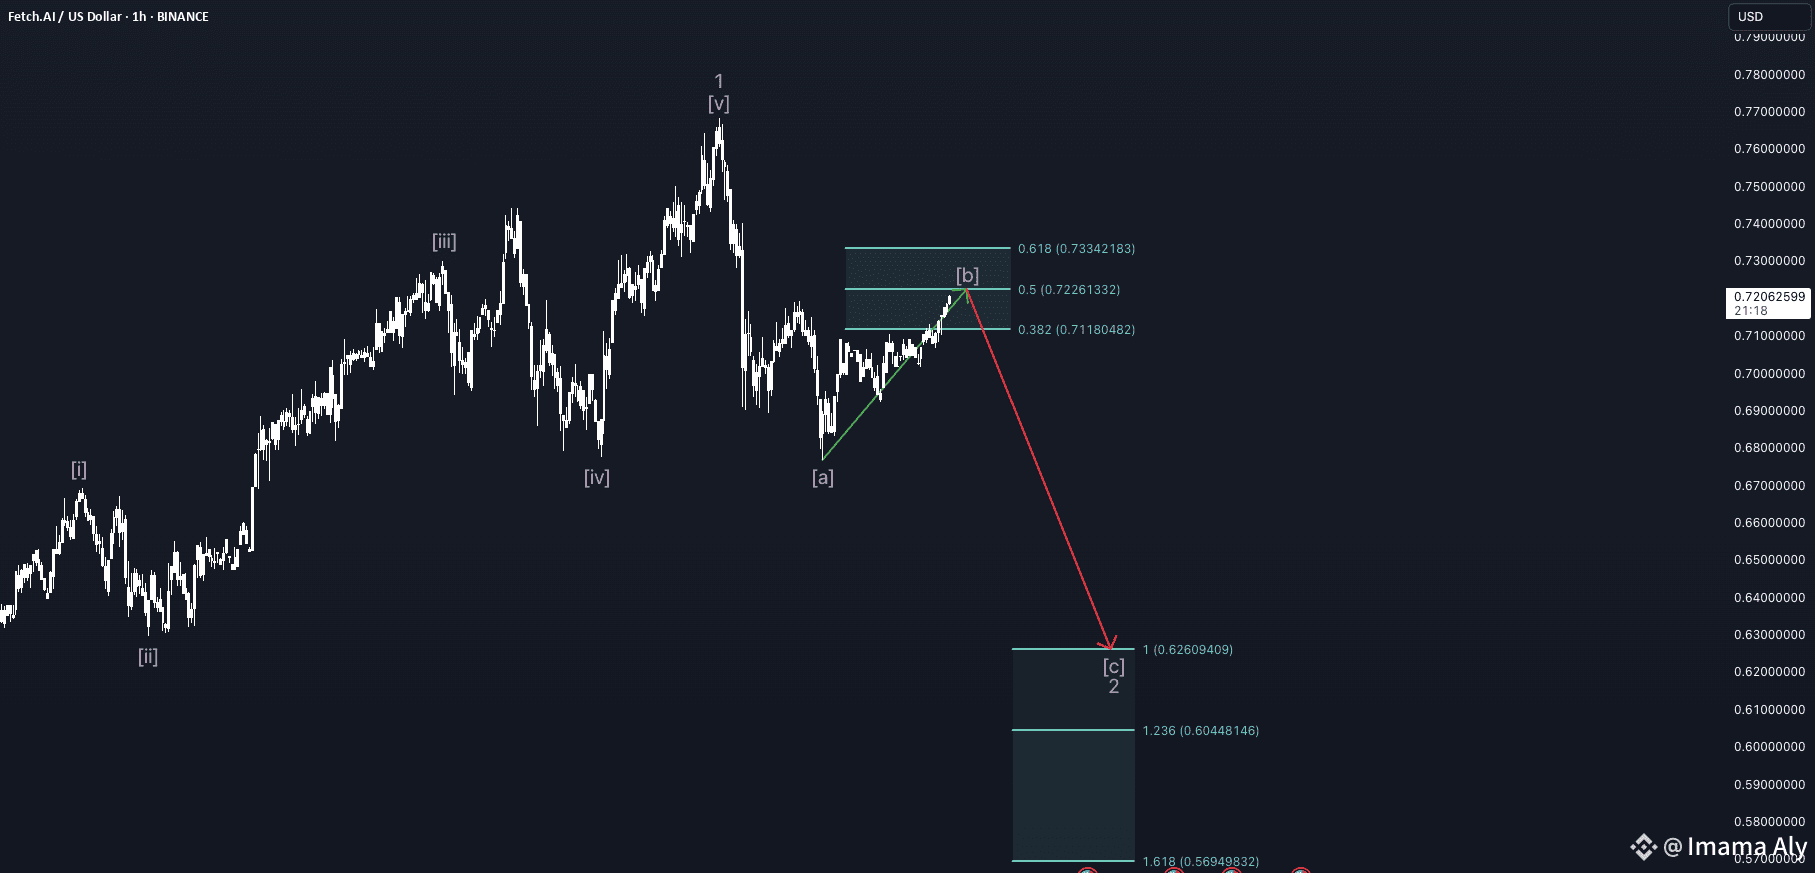
Elliott Wave Breakdown: FET appears to be in the final phase of Minor Wave 2, possibly during Minute Wave C, aligning with the broader Intermediate Wave 3 setup—pointing toward deeper correction before the bullish Wave 3 unfolds.
Liquidity Patterns: Key liquidity clusters align near the 50% retracement of Minute Wave B, suggesting likely entry zones for shorts. The order book remains sparse, particularly around the peak of Minor Wave 1—indicating thin support waiting to be tested.
Derivatives & Market Mood: Funding rates are neutral, driving neither overly bullish nor bearish sentiment. Open Interest (OI) has risen slightly but remains below the highs of Minor Wave 1. The Cumulative Volume Delta (CVD) is still negative, indicating weak buying pressure. Ideally, we’d want to see CVD drop further as Minute Wave C resumes.
Strategy & Outlook
Primary Bias: Bearish, with a short-side preference as FET retests the 50% retracement zone.
Trade Trigger: A validated bounce or failure within this zone could offer strong shorting opportunities.
Reversal Watch: Completion of the current corrective sequence would likely usher in Minor Wave 3, which is historically the most powerful portion of an Elliott Wave cycle.
FET’s Broader Landscape
Wave Trends: This setup isn't unique—many altcoins are exhibiting similar wave correction patterns, adding credence to the analysis.
Macro Sentiment: While some forecasts see FET reaching $0.79–$0.92 by end of 2025, these are longer-range predictions and hinge on the end of the corrective phase.
Bottom Line
FET is navigating a structurally bearish correction, with momentum indicators, liquidity flow, and wave counts suggesting additional downside. However, this correction stage sets the stage for a major impulsive rally down the line—when it arrives, it may deliver significant upside. Stay alert, trade smart, and prepare for a potential reversal.
