The previous explanation was about the terminal inclined triangle, and this time we will explain the guiding inclined triangle. The guiding inclined triangle was not discovered by Elliott the latest, but it has appeared sufficiently in the market, leading the author to believe in its validity for quite a long time.
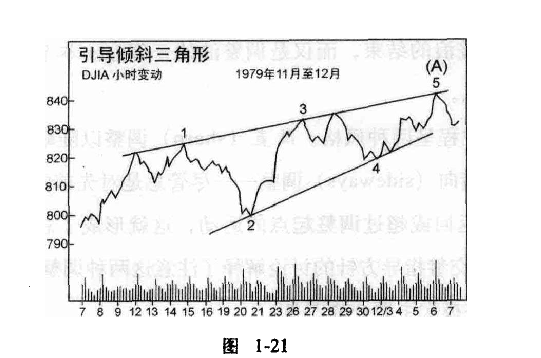
When the inclined triangle appears in position 5 or C, it takes on the 3-3-3-3-3 shape described by Elliott. A variant of this pattern often appears in the position of impulse wave 1 and in the position of corrective wave A. The unique overlap of waves 1 and 4, along with two boundary lines converging into a wedge shape, still resembles that in a terminal inclined triangle. However, its sub-waves differ, presenting a 5-3-5-3-5 pattern. This structure aligns with the spirit of wave theory, as the five sub-waves of the action wave convey 'continuation' information, while the three sub-waves of the terminal inclined triangle's action wave imply 'termination'. Here, I greatly admire the translator's level of skill and the profound depth of Chinese culture; termination and guidance truly deserve their names.
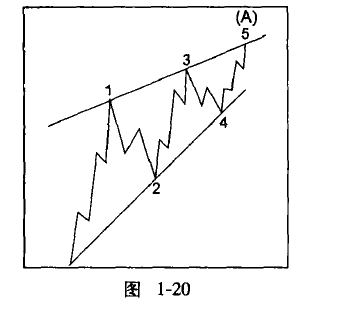
The key to recognizing this pattern is that, compared to the third sub-wave, the price change of the fifth sub-wave is noticeably slower. In contrast, during the development of the first and second waves, the short-term speed often increases, and the breadth often expands.
Key point: The terminal inclined triangle often appears at the position of wave 5 or wave C, while the guiding driving triangle frequently appears at the position of wave 1 or wave A. Both are ascending wedges, one bearish and one bullish; similarly, the descending wedges are also one bullish and one bearish. This is due to their differing positions.