The rhythm of the crypto market is starting to accelerate again! 📈 From #SONIC rebound to #OKB hot futures market, to #xrp potential explosion indicated by monthly RSI, every piece of data seems to remind investors: opportunities are here, but don't let short-term fluctuations deceive your eyes. #加密市场回调
Today, we will take you through the latest dynamics of these three major hot coins — on-chain capital flows, trading activity, derivatives market heat, and the potential indicated by technical indicators. 💎 Whether you are a 'hunter' pursuing short-term profits or a 'diver' laying out long-term trends, this analysis can help you see the rhythm and risks behind the bull market. #山寨季何时到来?
Sonic, OKB, XRP, three fronts firing simultaneously, who can truly outperform the market? Let's reveal them one by one! 🔥
Sonic: Price rebounds, but on-chain activity lags behind

Sonic (S) has recently been a thrilling spectacle: after experiencing a 17% drop, the stock price quickly rebounded, becoming one of the best-performing coins in the market with an increase of about 10%.
On the surface, the inflow of capital and the growth of total locked value (TVL) seem to provide support for the price — in the past day, investors injected $21.05 million into Sonic's on-chain protocols, with on-chain net inflow reaching $832,000. 💰
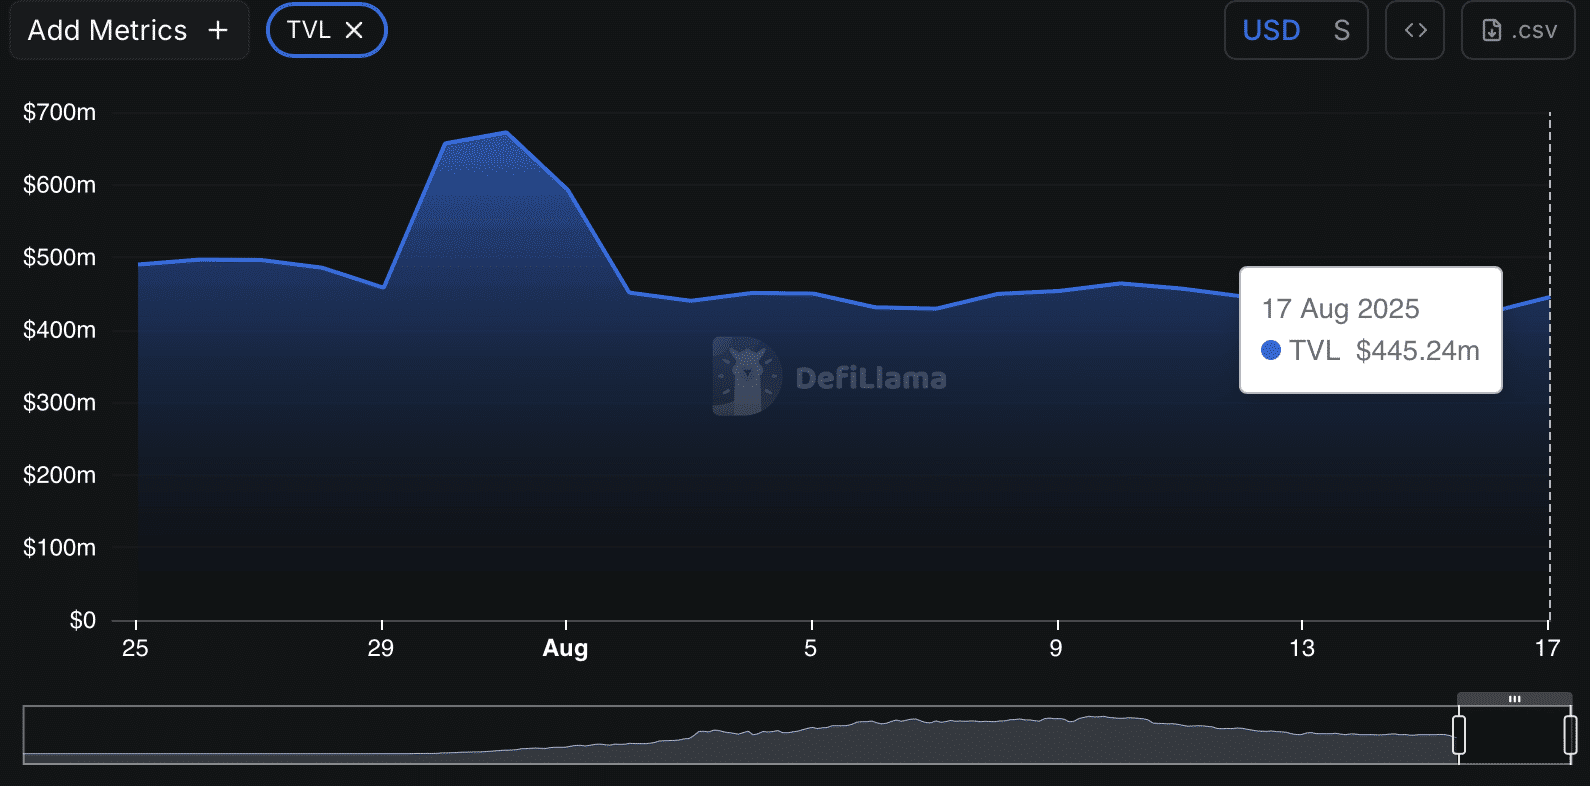
The increase in TVL suggests that market confidence in Sonic's long-term prospects has increased, as investors bet on its future potential. However, on-chain activity shows a different picture.
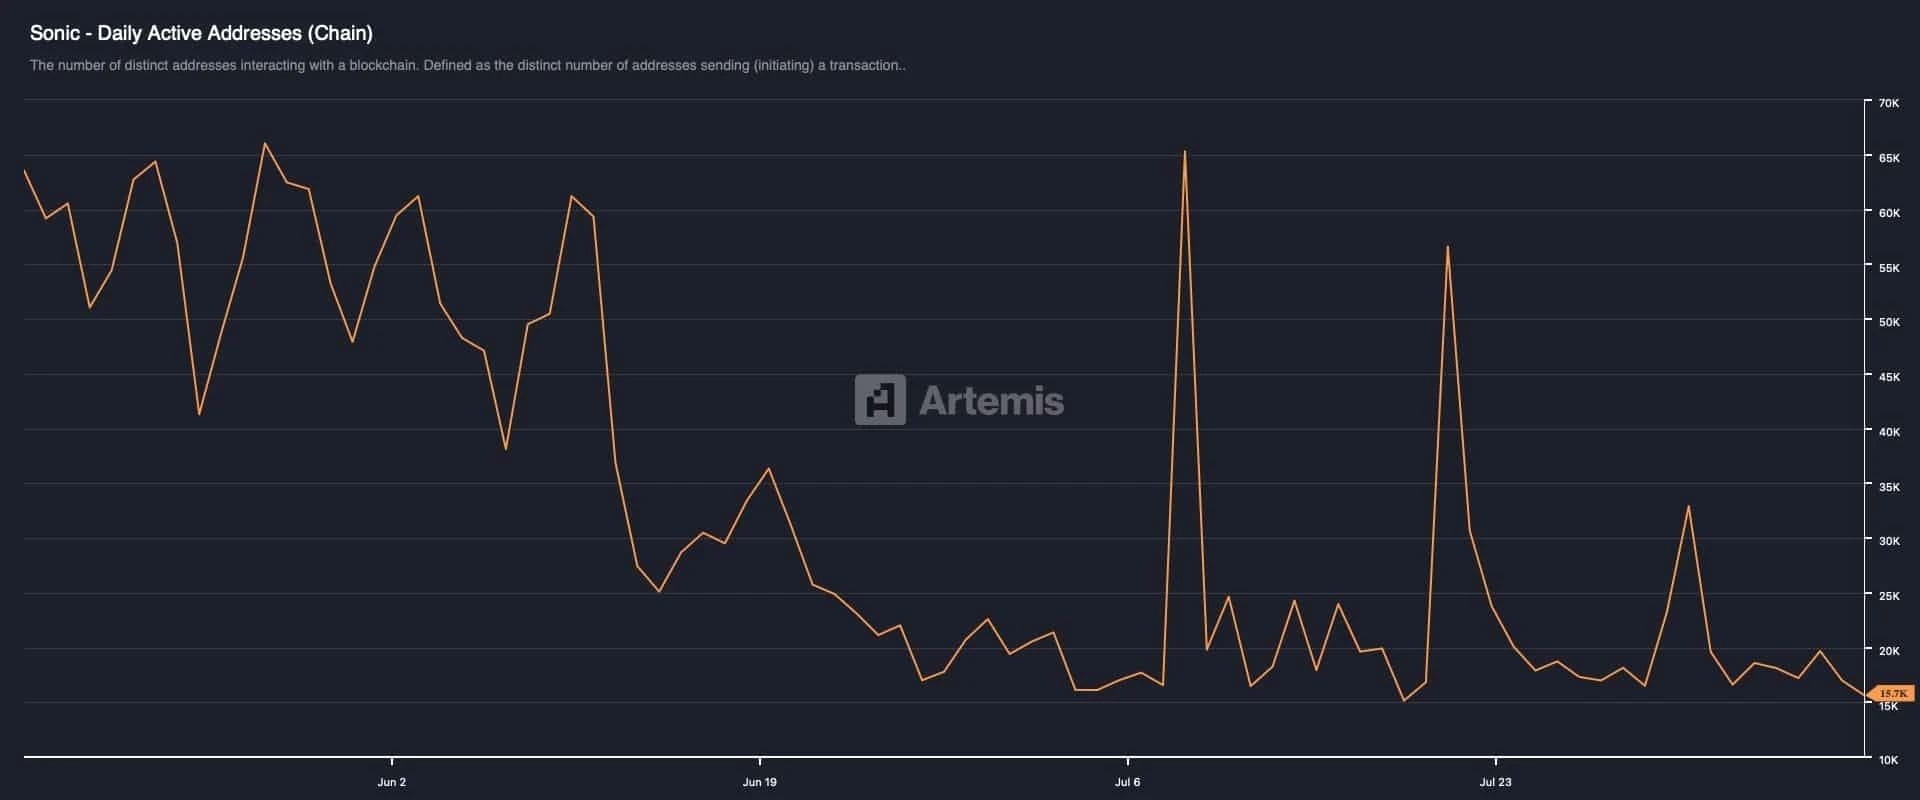
Despite the price increase, the number of active addresses for Sonic has decreased to 15,700, just 500 addresses away from the annual low, while daily trading volume has dropped from a historical high of 27.5 transactions/user to 18.7 transactions/user.
In other words, the price increase may be more driven by capital inflow rather than an increase in actual usage. On-chain data from centralized exchanges also indicate that Sonic's daily trading volume is $6.14 million, down 32%, while liquidity in the derivatives market has only slightly increased. 📉
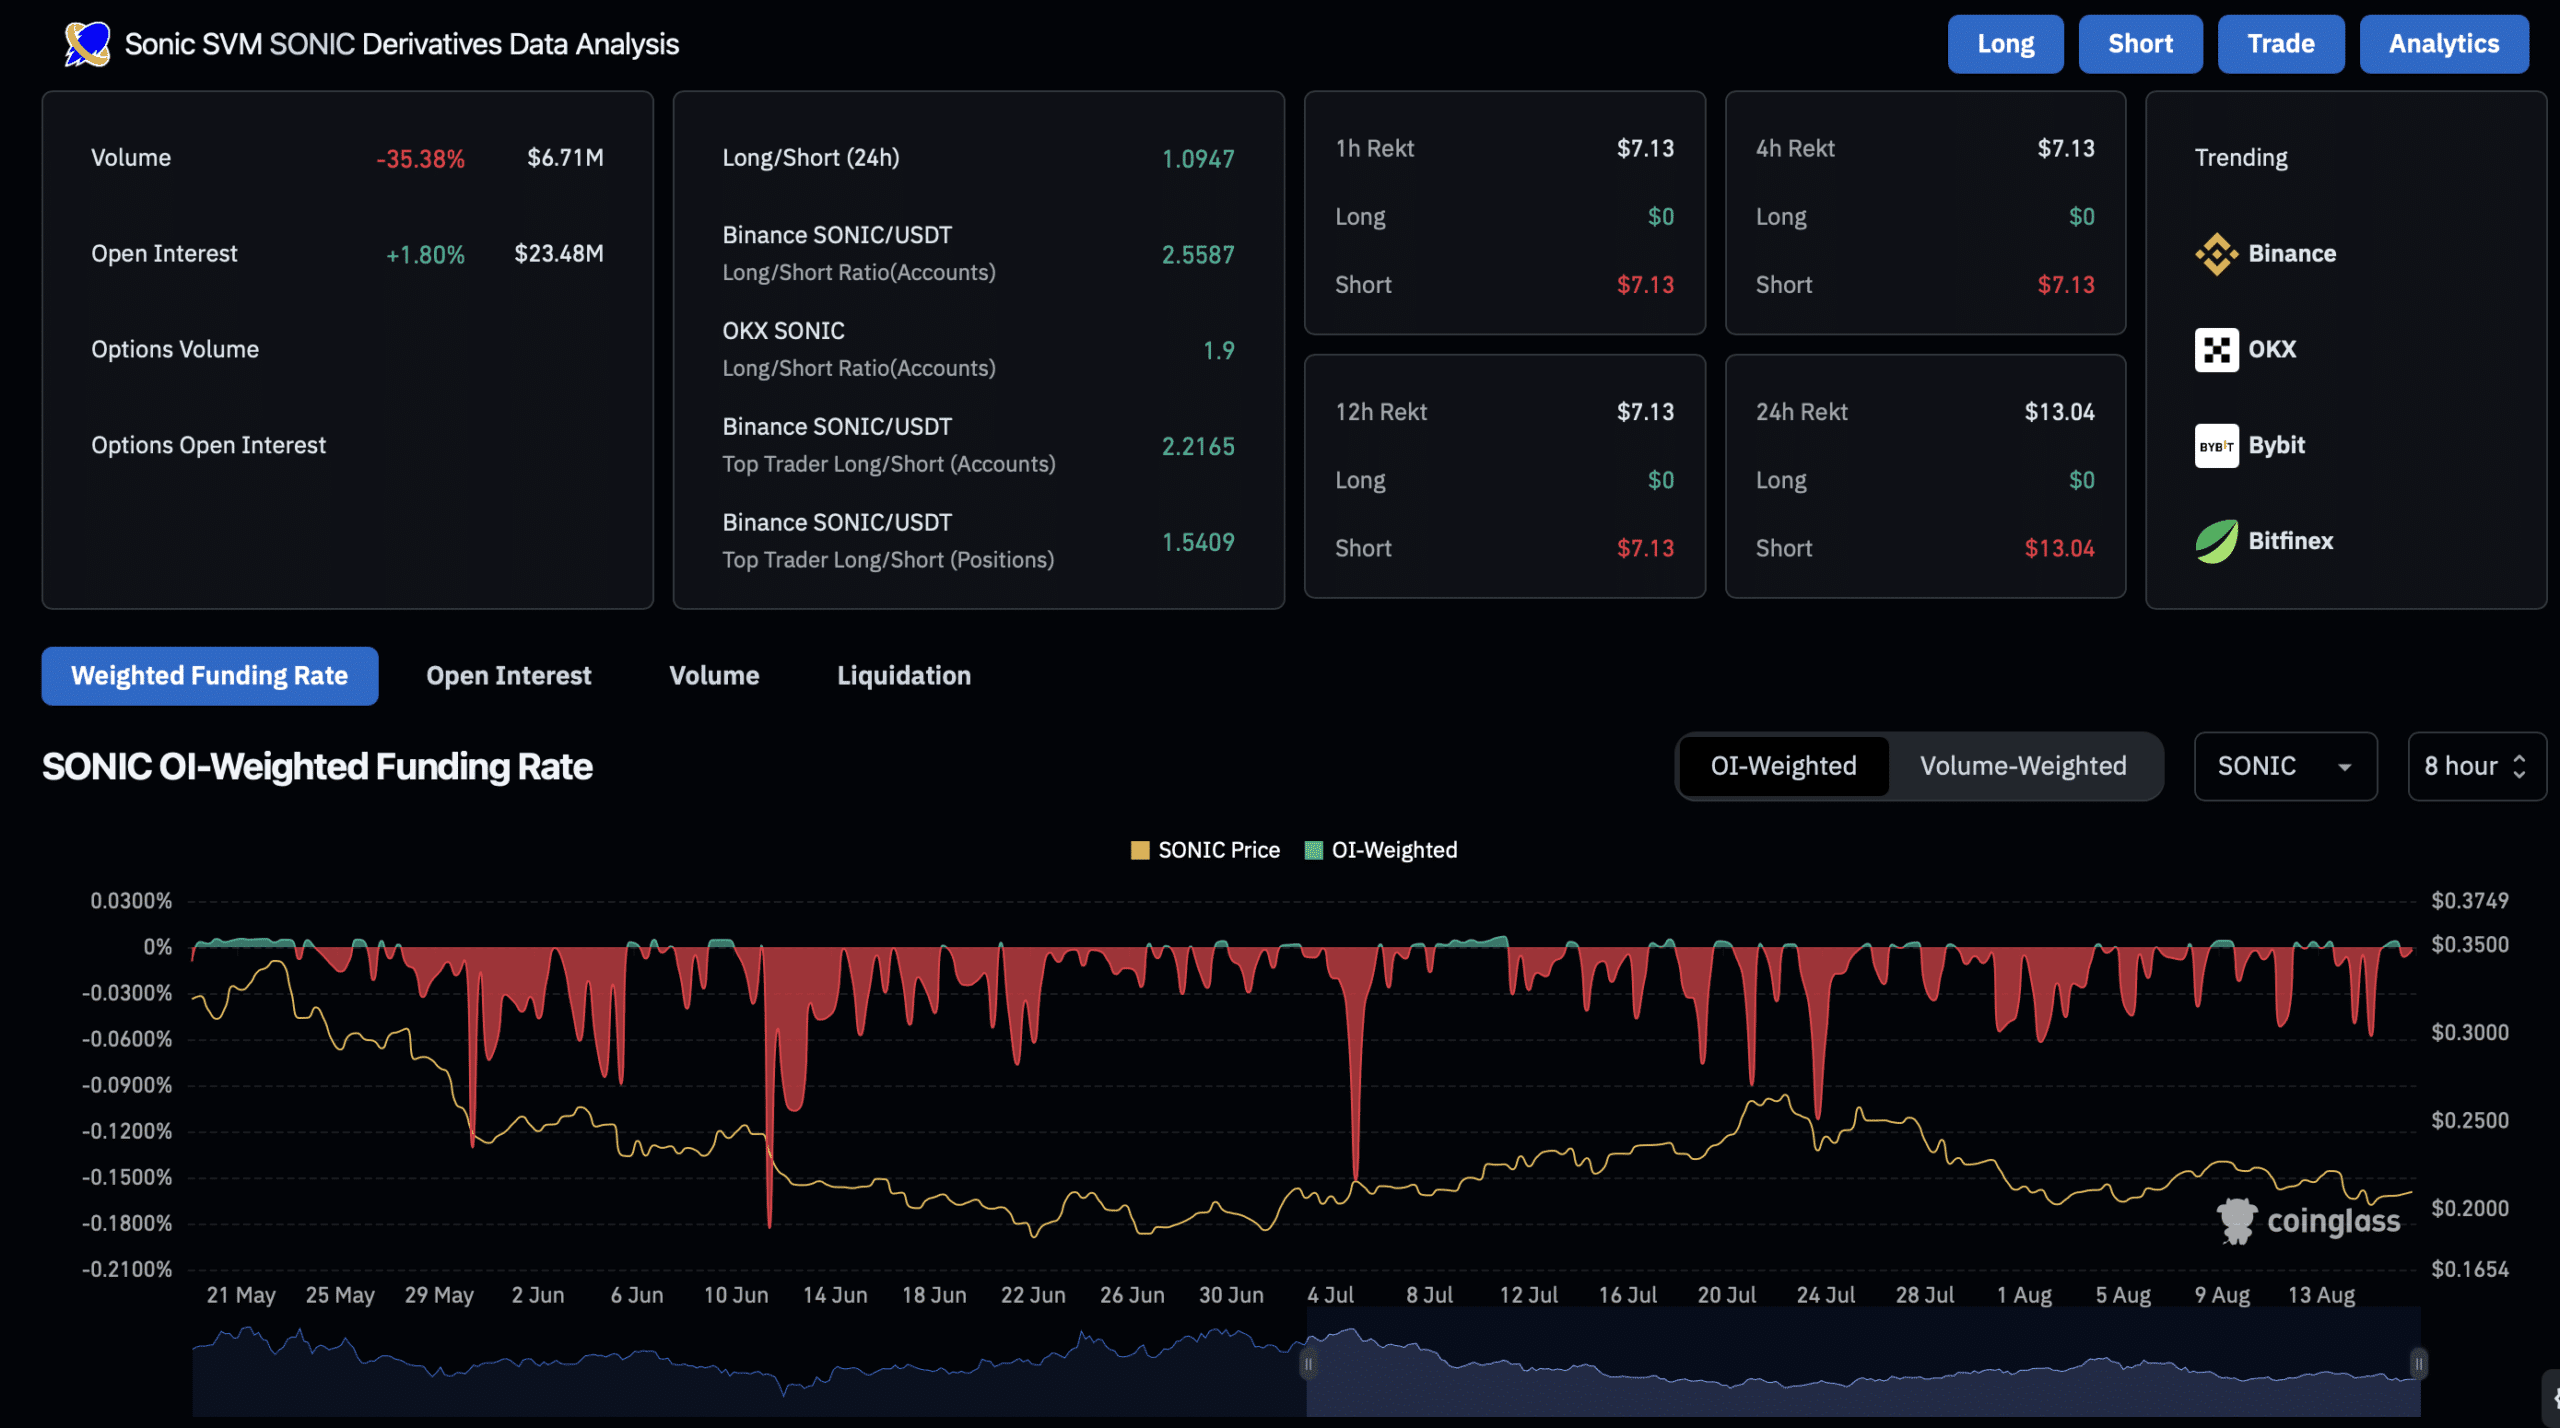
CoinGlass's open interest data shows that Sonic's derivatives market is practically 'napping' 💤 — total liquidity is only $23 million, with a slight increase of $340,000 in the past day.
Liquidation data is also very quiet 😅: Traders have hardly moved, with positions withdrawn being less than $200, indicating obviously low market interest and weak sentiment.
Conclusion: If this phenomenon of lagging on-chain and off-chain activity continues, Sonic's short-term gains may face pullback risks. For investors, while the upward trend is tempting, the potential for a pullback should not be overlooked.
OKB: Futures frenzy and potential pullback
In contrast to Sonic, OKB's market shows typical short-term speculative characteristics. OKB rebounded from a recent low of $88 to a high of $131, with a rise of up to 38%, and then slightly pulled back to $127. Trading volume surged by 284%, and its market cap rose from $2 billion to $2.7 billion. 📊
Behind this rise is the active participation of the futures market. Data shows that OKB's open interest skyrocketed by 120.7%, reaching a new 10-month high of $4.79 million, with derivatives trading volume jumping to $27 million, and the long-short ratio rising to 1.075, indicating that the bulls are in control. It appears that bullish forces are propelling the price upward. 🚀
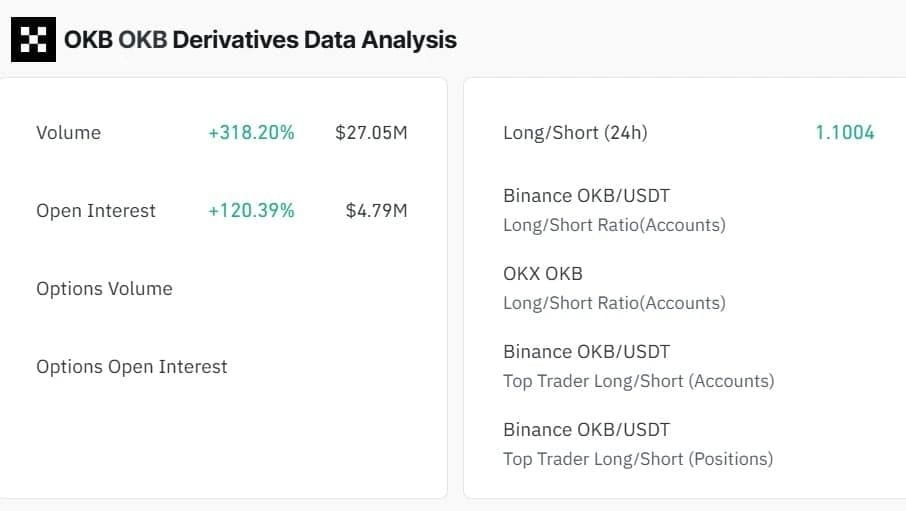
CoinGlass data shows that OKB's spot net flow surged to a positive value, currently reaching $13.47 million, further up from $8.1 million the previous day 📈.
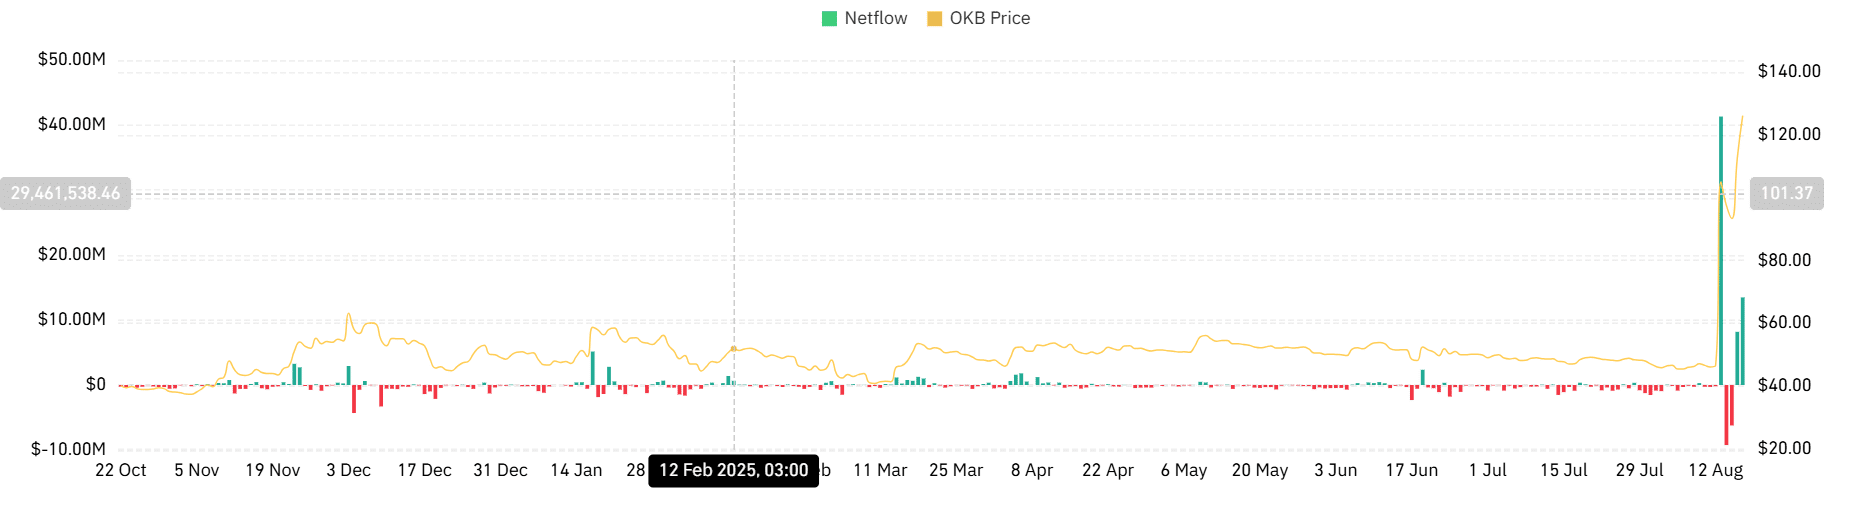
Typically, a surge in netflow indicates that capital inflow into exchanges exceeds outflow, meaning that bullish forces are quietly accumulating ⚡, but at the same time, profit-taking pressure cannot be ignored.
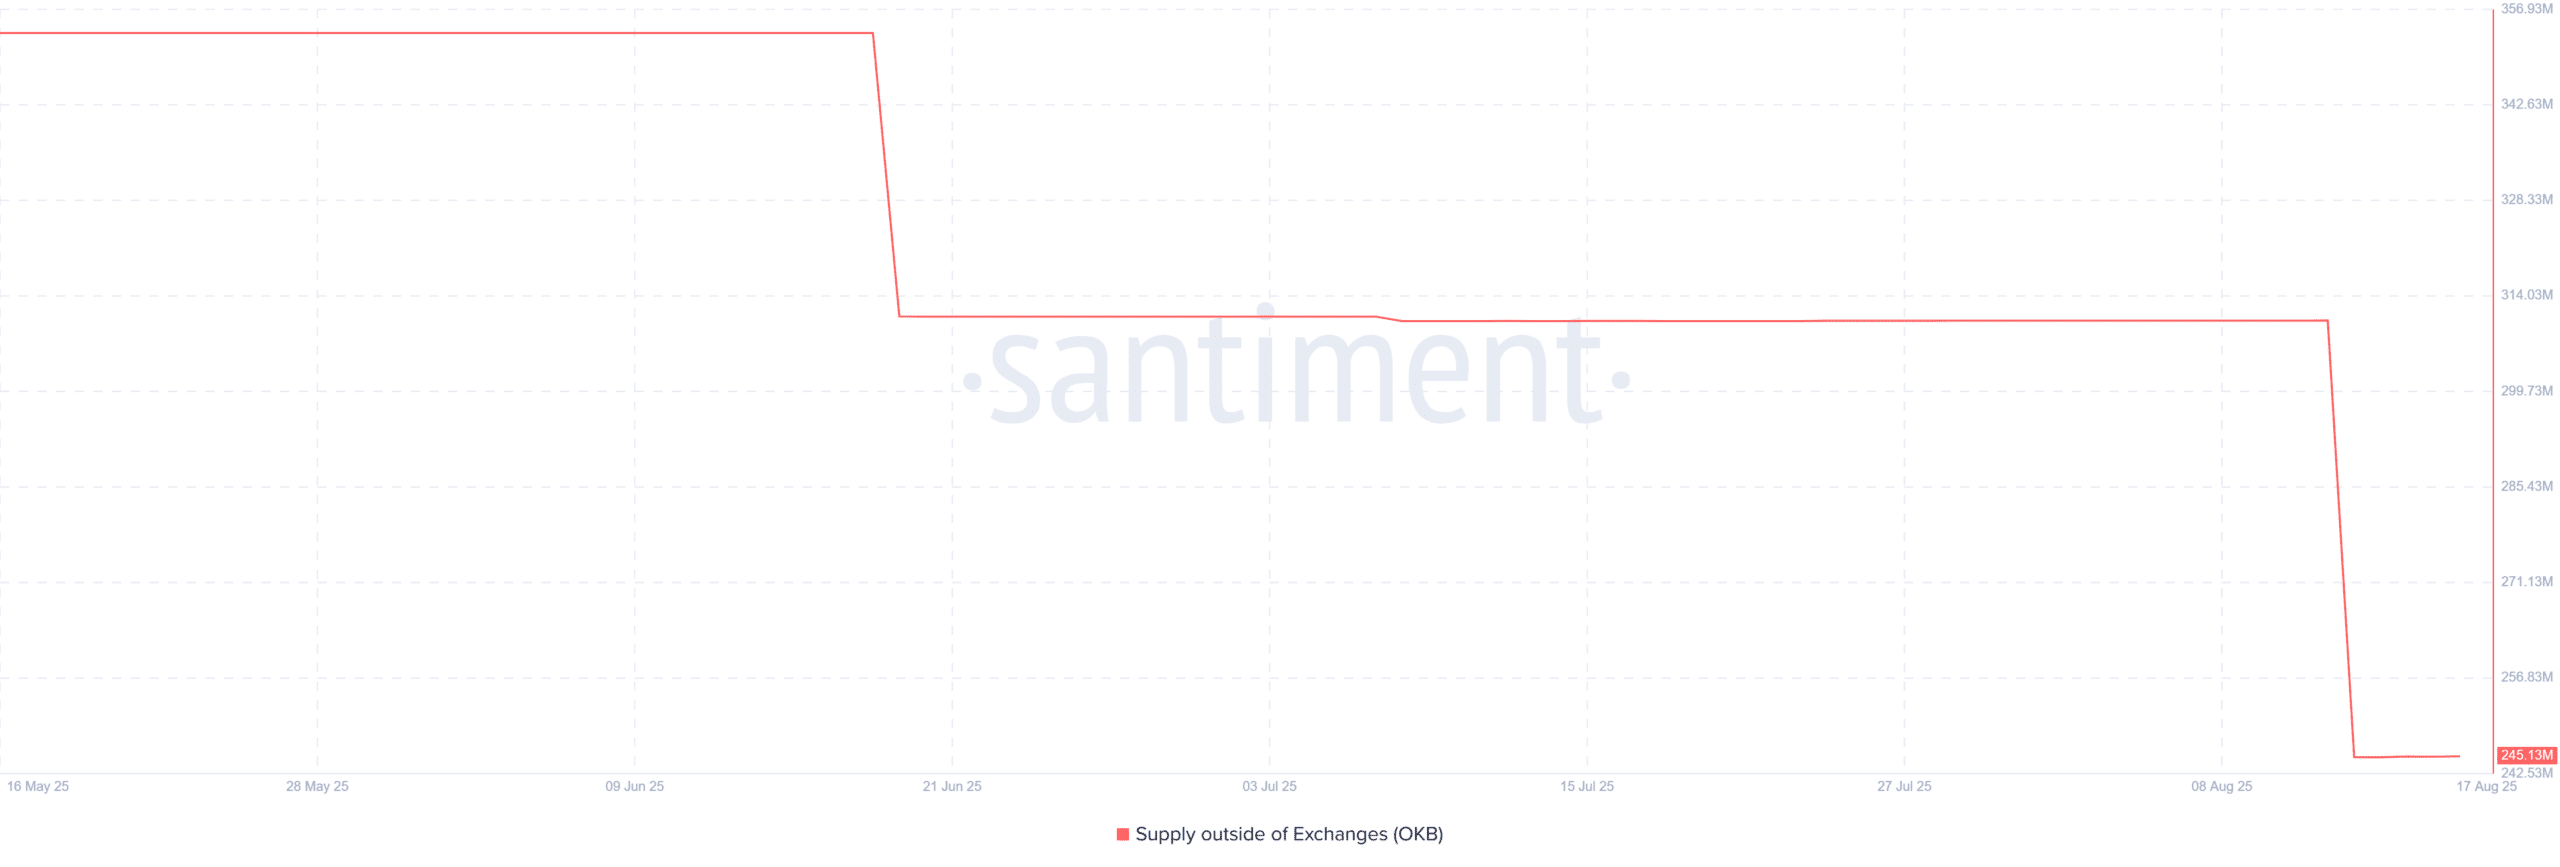
Exchange net flow shows that spot supply has dropped to a three-month low of $245 million, indicating that many investors are cashing out at high levels, with potential selling pressure that could trigger a price pullback at any time.
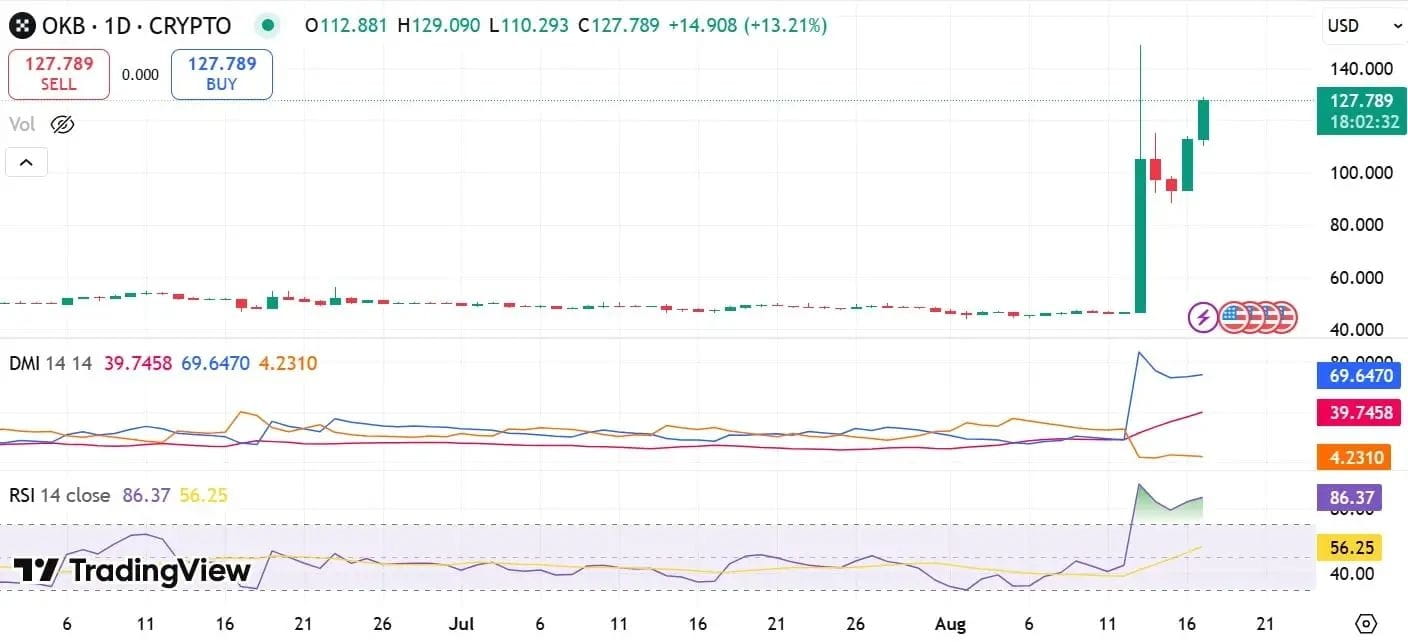
In terms of technical indicators, OKB's RSI has reached 86, entering the overbought zone, while the Directional Movement Index (DMI) indicates strong upward momentum.
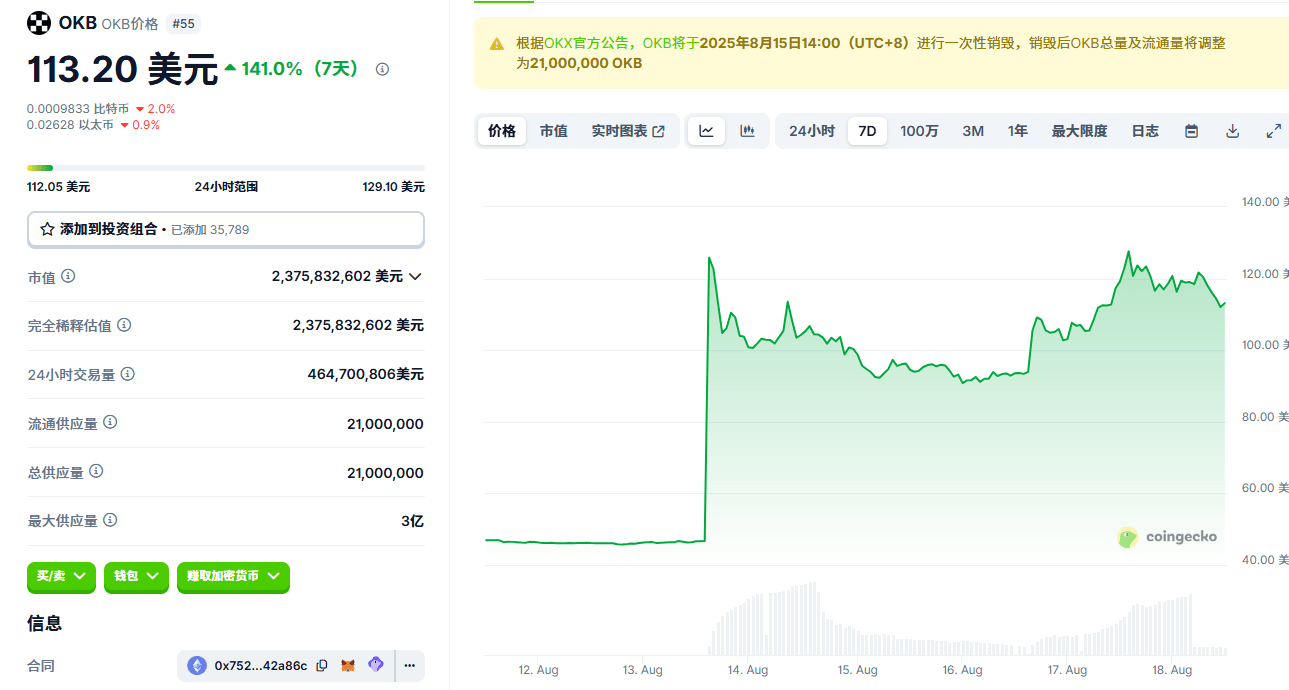
Conclusion: If the bullish momentum continues, OKB has a chance to test the resistance level of $148, but the emergence of profit-takers may cause the price to pull back to around $92.7. Investors need to remain vigilant when chasing short-term opportunities. ⚖️
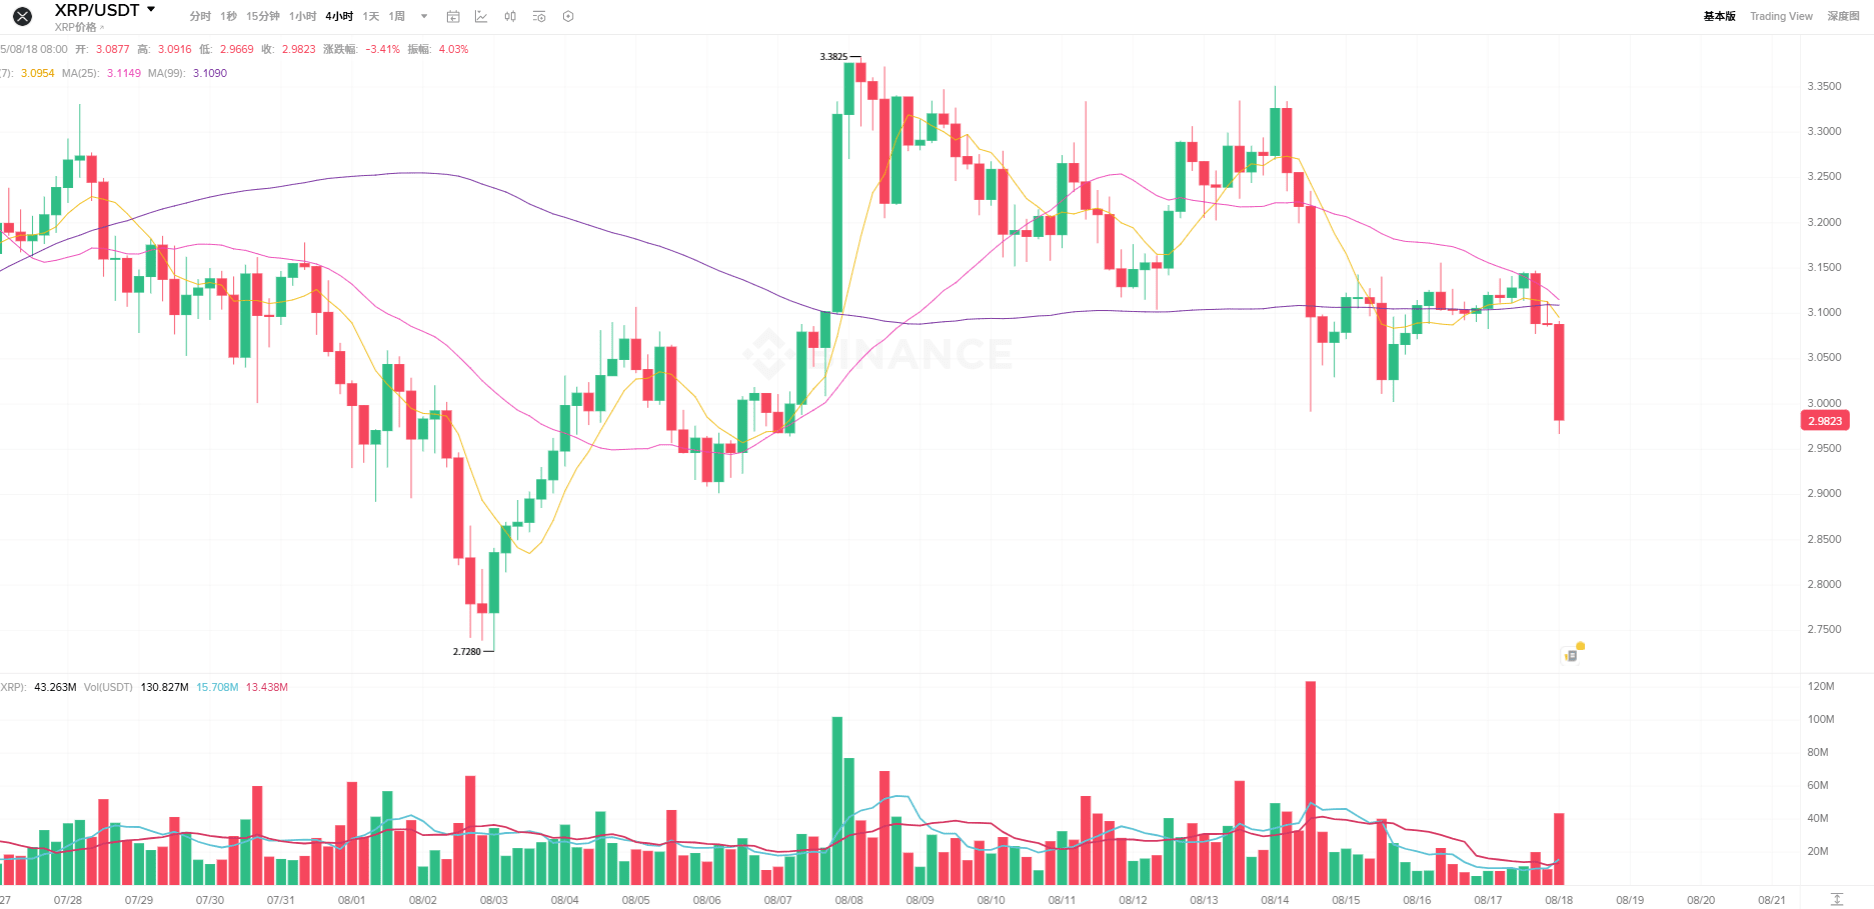
XRP: Monthly RSI points to third cycle explosion
Finally, let's take a look at XRP. Unlike Sonic and OKB's short-term fluctuations, XRP's trend is showing a clear periodic pattern. According to technical analyst Egrag Crypto's research, XRP's monthly RSI has entered the so-called 'third cycle', which is a key stage for explosive price surges in history. 📈
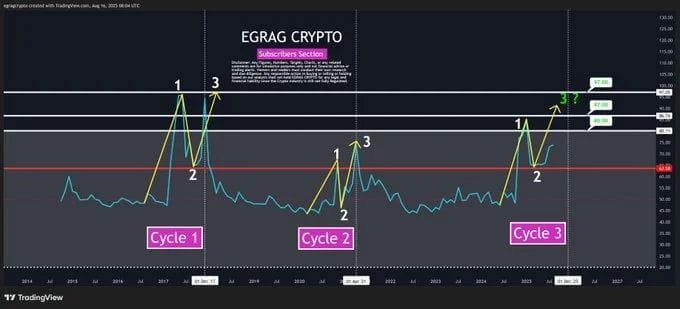
Looking back at history, XRP has experienced similar three-phase RSI patterns in 2017 and 2021: the first phase is an increase, the second phase is a pullback, and the third phase is an explosion. Currently, XRP has completed the rise and pullback phases, and the remaining third phase is expected to push the price to new highs. Analysts predict that this round of RSI peaks may reach 80, 87, or even surpass 97.
If the RSI truly breaks through 90, this will become one of the strongest overbought signals in XRP's history. Combined with bull market logic, a high RSI does not mean an immediate pullback, but may continue to drive the price up, breaking the historical high of $3.65, and even challenging $4, $5, or even double-digit levels. 💥
Conclusion: XRP's trend shows bull market potential and long-term investment value, rather than mere short-term speculation. For patient investors, this may be an opportunity for layout.
Comprehensive analysis: Opportunities and risks in the rhythm of the bull market
In comparison of the three, we can find some interesting patterns:
Capital flow vs actual activity: The price increase of Sonic is mainly driven by capital inflow, while on-chain activity and trading volume lag behind, leading to a high risk of short-term pullback.
Futures frenzy vs profit-taking pressure: The rise of OKB is driven by bullish futures, but profit-taking pressure also exists, causing significant short-term price fluctuations.
Periodic explosion vs long-term potential: XRP's monthly RSI shows the potential for an explosion in the third cycle, with bull market logic supporting its long-term upward potential.
In terms of investment strategy, short-term players can focus on the volatility opportunities of OKB but must be wary of pullbacks; Sonic's capital inflow is worth noting, but the declining activity signals risk; XRP is suitable for patient medium to long-term layout, focusing on the potential explosion brought by the third cycle. 💡
In this rhythm of the bull market, on-chain data, derivatives market dynamics, and technical indicators together shape the characteristics of each coin. Whether pursuing short-term profits or laying out long-term trends, understanding the subtle signals of the market will be key to investment success. 📊
Summary:
Sonic, OKB, and XRP each have their characteristics — one is a rebound driven by capital, one is a short-term surge driven by futures frenzy, and one is a potential explosion indicated by technical indicators. The crypto space is never short of opportunities, but it is always accompanied by risks. Grasp on-chain and off-chain signals, understand the rhythm of technical indicators, and you can move steadily forward in the bull market. 🚀💎
Many understand the trend, but not many keep the right rhythm.
Like and share 👍, follow me to capture more market trends and watch the bull and bear fluctuations with you! Let's work hard together!
In the current market environment, short-term operations are indeed necessary. If one keeps waiting for spot prices to rebound, they might feel the agony of time. I've recently been fully engaged in secondary short-term operations and primary 'dogecoin' operations, yielding good results. Friends who want to keep up can message me privately on V!