
Technical analysis in financial markets relies on various tools that help traders understand price movements and predict future trends. Among these tools, Candlestick Charts stand out as one of the most important and popular methods used by analysts and traders for hundreds of years. The origins of this tool date back to Japan in the 17th century when rice traders used it to track price movements. Today, candlestick charts have become the cornerstone of reading financial markets of all types, whether stocks, foreign currencies (Forex), or cryptocurrencies.
What are candlestick charts?
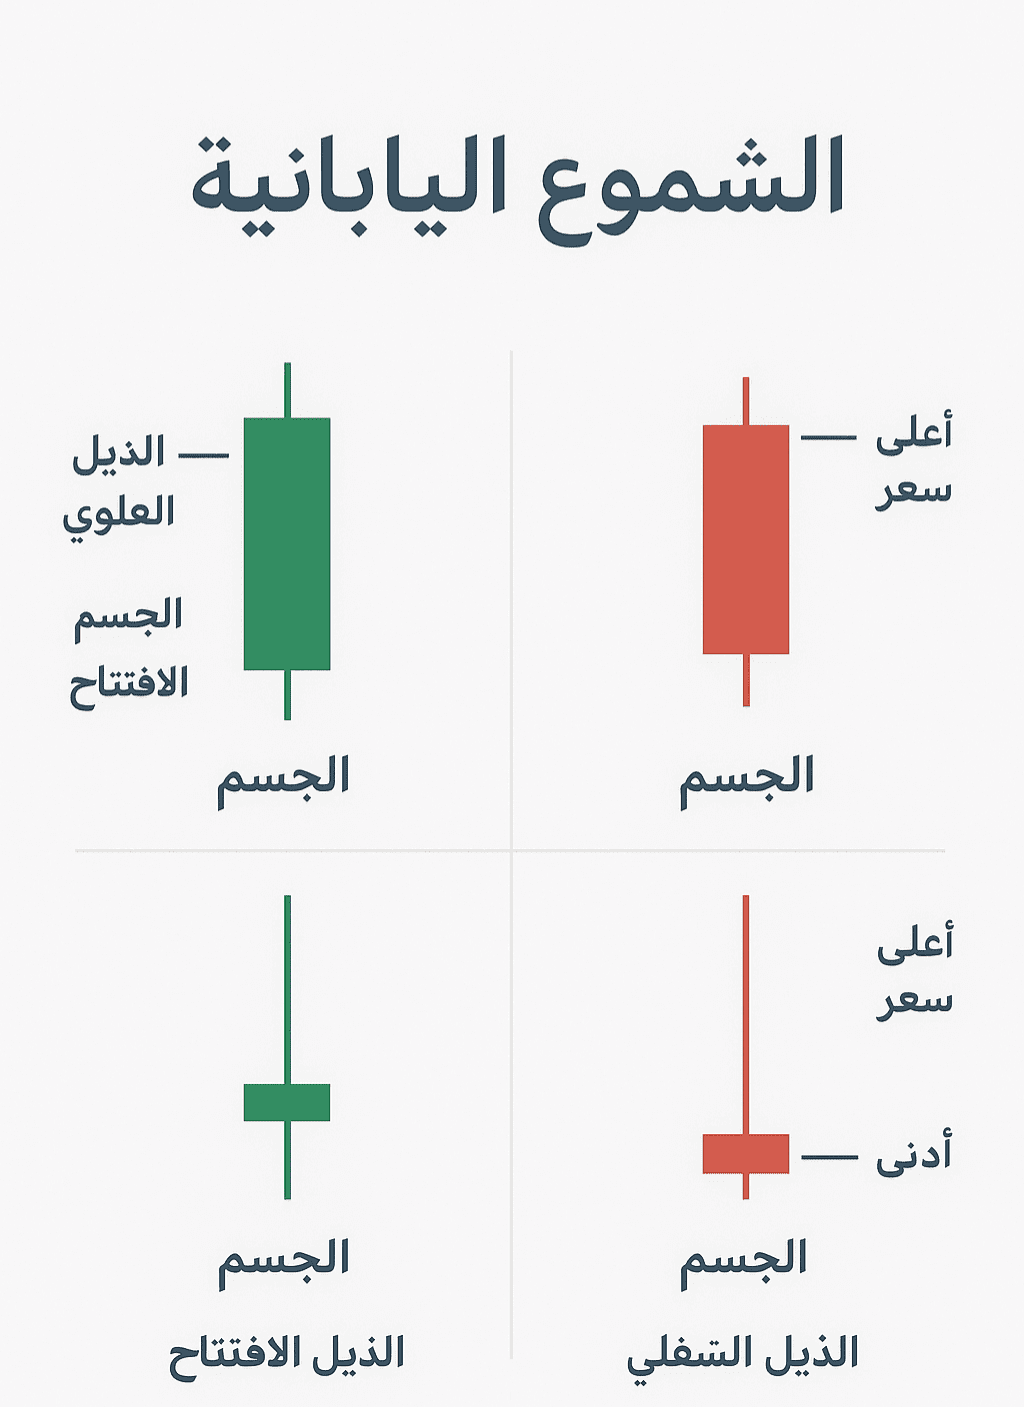
A single candle represents price movement over a specific time period (minute, hour, day, week...). It is not just a simple line but provides a comprehensive picture as it displays four essential values:
Opening Price (Open)
Closing Price (Close)
Highest Price (High)
Lowest Price (Low)
These four values make candlestick charts clearer than traditional charts like lines, as they provide details about market strength over the period.
The Benefits of Using Candlestick Charts
1. Clearly displaying price movement
The most prominent feature is that they provide a direct visual insight. A trader can quickly tell if the candle is bullish (usually green) or bearish (usually red).
2. Identifying trends
Using sequential candles can help identify the general trend of the market:
Bullish trend when the green color dominates and long bullish candles appear.
Bearish trend when the red color dominates and strong bearish candles appear.
Sideways trend when there are short and fluctuating candles within a narrow range.
3. Predicting trend reversals
One of the main reasons for the popularity of candlestick charts is the presence of patterns with clear implications. For example:
Hammer: Typically appears at the bottom of a downtrend and indicates a potential bullish reversal.
Hanging Man: The opposite of the Hammer, appearing at peaks and indicating a potential start of a downtrend.
Engulfing: When a strong candle engulfs its predecessor, indicating a potential change in direction.
These simple patterns provide early signals that help the trader make strategic decisions.
4. Clarifying the strength of buyers and sellers
The length of the candle body and shadows (wicks) gives a direct impression of market strength:
Long green candle: Strong buying pressure.
Long red candle: Strong selling pressure.
Long upper wick: The market rejected high prices and returned down (control of sellers).
Long lower wick: Rejection of low prices and a return to rising (control of buyers).
5. Ease of integration with other indicators
Candlestick charts are not used in isolation from other technical analysis tools but can be combined with indicators such as:
RSI (Relative Strength Index): To identify overbought or oversold conditions.
MACD: To confirm the momentum direction.
Support and Resistance: Candles provide clearer signals at these levels.
Practical Example
When a long green candle appears after a downtrend, it may signal a return of buyers and an entry into an upward wave.
If a long red candle appears at the peak of a rise, this indicates significant selling pressure and a potential start of a downtrend.
If a candle with a long upper wick appears, it indicates that the price tried to rise but sellers overcame and rejected the high levels.
Why is it important for every trader?
Candlestick charts are not just aesthetic drawings; they are a visual language for understanding the market. By learning to read them, traders can:
Identify the best entry and exit points.
Reduce risks by paying attention to early reversal signals.
Enhance their strategy by integrating it with other tools.
Candlestick charts are a fundamental tool for understanding market dynamics. They combine simplicity in form with precision in meaning, providing a quick view of price trends and the strength of supply and demand. Learning to read these candles is a necessary step for any trader who wants to succeed in the markets, as they serve as the 'language of the market' that clearly reveals the intentions of buyers and sellers. With practice and integration with other indicators, candlestick charts become a powerful means for making informed decisions that increase profit opportunities and reduce the chances of loss.

