In the bullish phase of August, Ripple (XRP) is lagging among the Top 20 tokens. Currently priced at 3.112$ and experiencing a weekly contraction of -1.90%.
Ripple slows down in August
In August, XRP is recording a limited rise of +3%, much lower than the main altcoins, even though Bitcoin is growing less.
Weak August for XRP but not for 2025
In the attached chart, we report the performance of the Top 20 in August, where it is observed that Ripple, despite rising, ranks among the lowest positions compared to other major tokens by market capitalization. The best performer so far is Chainlink, analyzed yesterday, with a growth of +35%.
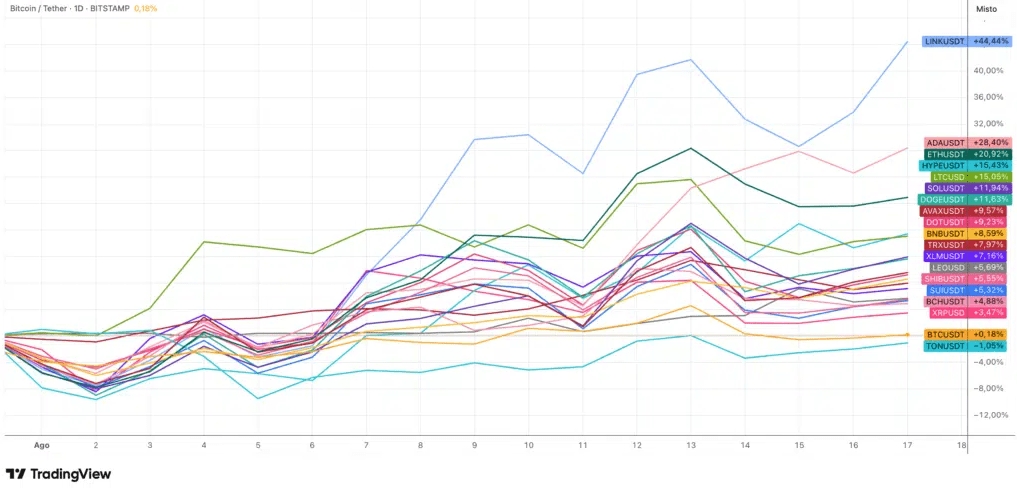
From a technical standpoint, looking ahead to early 2025, Ripple ranks among the top tokens: Hyperliquid shows a +76%, followed by Tron with +37% and Ripple with +34%.
Crucial August for Ripple
The month of August was particularly important for Ripple, balanced by two factors: on one hand, new regulatory clarity with the end, after nearly five years, of the lawsuit with the SEC; on the other hand, the start of profit-taking that led to a partial price correction. Compared to the July high of 3.665 USDT, the current value shows a contraction of about -15%.
In this scenario, we report a reflection made two days ago by the CTO of Ripple, who highlighted how institutional players can shift value onto the XRPL ledger without necessarily using the XRP token. A point that underscores the broader utility of the Ripple ecosystem, beyond the token itself.
Weekly overview of Ripple
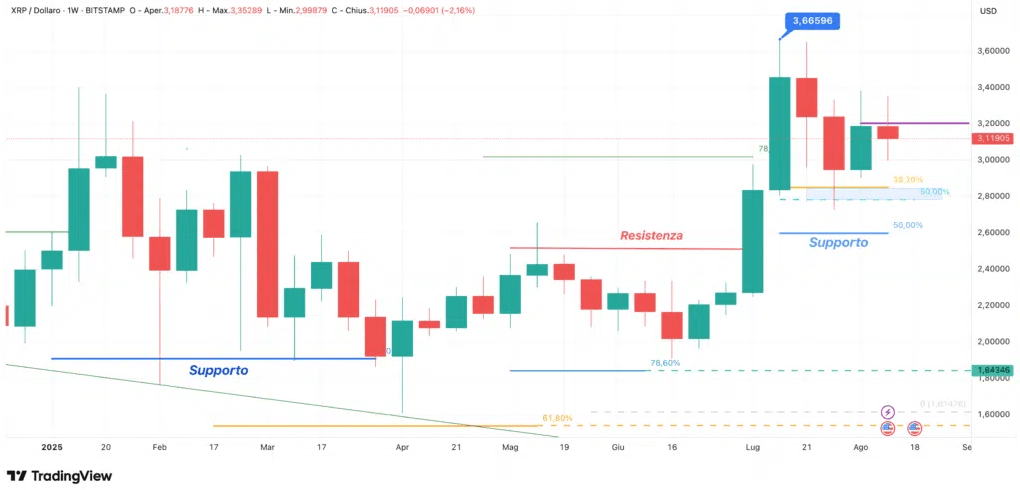
Analyzing the price trend of XRP, we start from the weekly chart, which offers an overview from the beginning of January 2025, when the token reached an initial high of 3.40$. From this level, a descending phase began that caused the price to drop below the main support in the 1.90$ area, until it hit a low of 1.6118$ in April. Over 12 weeks, XRP recorded a decline of 52%.
From that low, a rebound phase began, with a series of swings and tests of resistance in the $2.50 area in May, from which the price then retraced to the June low of 1.90 USDT, before starting to rise again.
In July, XRP broke the resistance at 2.50 USDT, recording a rise of about 40-45% in two weeks, reaching a high of 3.665$. From that level, a downward phase began, bringing Ripple to the support area by the end of July.
Daily scenario of Ripple
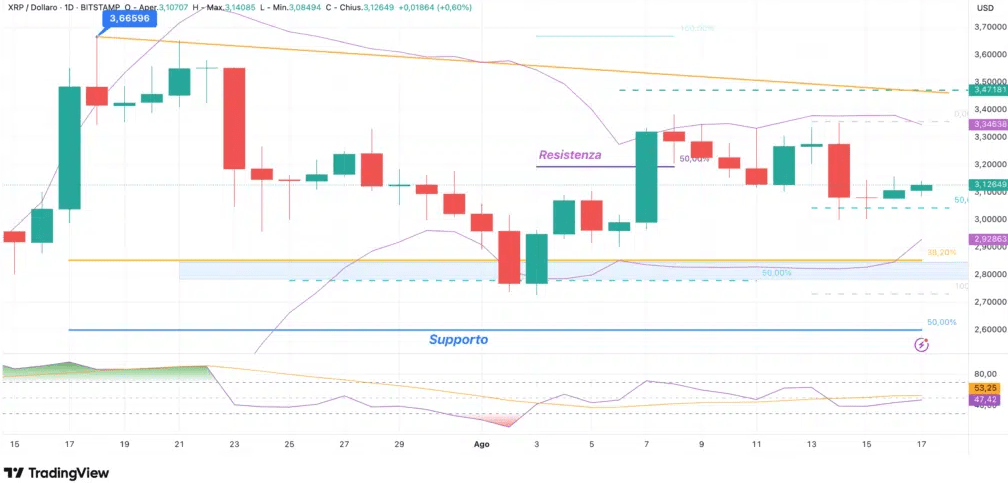
Observing the daily chart, the correction phase following the break of resistance at 3.20$ is evident. From that level, in the last ten days, Ripple has stalled, entering a decline that has led to testing the first short-term support in the 3.05$ area.
On August 12, $XRP recorded an intraday drop of 8.5%, reaching a low of 2.998 USDT. This movement signals the delicacy of the current phase, with the possibility that the price may return to test the main support area already tested at the beginning of August.
The RSI indicator is also showing signs of exhaustion, highlighting the loss of strength in the bullish trend.