In this hot August, not only Ethereum shines among the Top 20, but also Chainlink (LINK), which has recorded an increase of +35.84% since the beginning of the month. Currently, $LINK is priced at 22 USDT, and on a weekly basis, it is showing a slight contraction of 1% after reaching a high of 24.74 USDT three days ago.
Chainlink dominates the Top 20 of August
The strength of the last two months has brought LINK back into the green even on an annual basis, with a gain of +9%.
Weekly overview of Chainlink
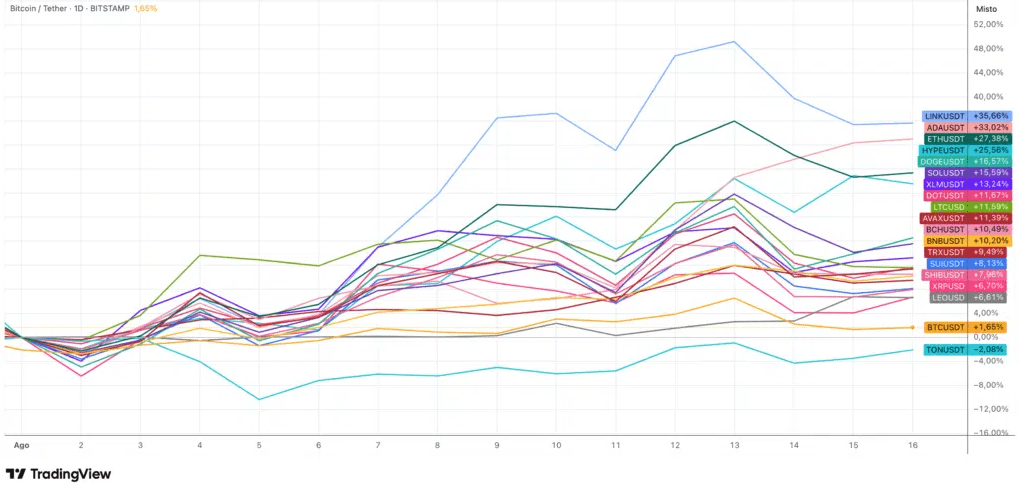
Among the August data, we report the performance of the Top 20: Chainlink stands out with an increase of +35.70%, followed by Cardano (+33%) and Ethereum (+27.38%). This movement brought LINK to a market capitalization of 14.8 billion, placing it 12th in the CoinMarketCap ranking, recently overtaken by Hyperliquid, which had a positive week.
Chainlink Reserve: the new factor
Among the factors that pushed LINK's price up in August was the launch of the Chainlink Reserve. This is an on-chain reserve of LINK tokens aimed at strengthening the sustainability and value of the network. Funded by off-chain revenues and on-chain fees, it has already accumulated over 109,000 LINK (2.4 million USDT). Bound by multi-year policies, it reduces the circulating supply, introduces deflationary pressures, and, with institutional partners, consolidates trust and adoption of the network.
Weekly overview of Chainlink
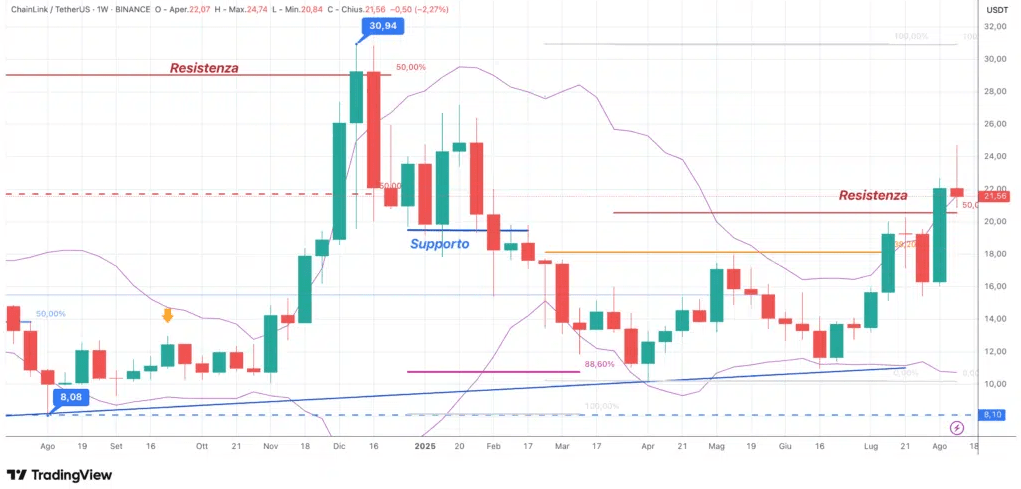
The performance of Chainlink can be observed on a weekly chart starting from last summer, when it marked a low of 8.08 USDT. From that level, a strong upward phase began, which brought the price up to a high of 30.94 USDT in December.
From the chart, it is noted that the price had stalled at the long-term resistance at 29 USDT, a level that remained key for a reversal and a possible resumption of Chainlink's bull market. The following weeks saw a clear bearish phase, continuing into 2025 until the break of support in the 19.40 area.
Downtrend in 2025 and rebound
The decline brought LINK to mark a low of 10.10 USDT in April, from which a rebound phase began that led the price up to the resistance around 18.10 USDT, a level already noted in the analysis of April 24. From there, a retracement followed that in mid-June brought LINK back to a low of 10.94 USDT.
August breakout
From that level, a new upward phase began that in August led to the decisive breakout of the medium-term resistance around 20.50 USDT. Last week's candle closed with a +35%, while the one currently forming shows a -2.40% after reaching a high of 24.74 USDT.
The weekly candle currently forming is a doji, positioned just above the resistance level. This setup configures possible reversal patterns, which is why it will be crucial to wait for tomorrow evening's close to confirm the trend direction.
Downward pressure for $LINK in recent sessions
On the daily chart of $LINK, the upward movement of August is observed, culminating three days ago with a high of 24.74 USDT.
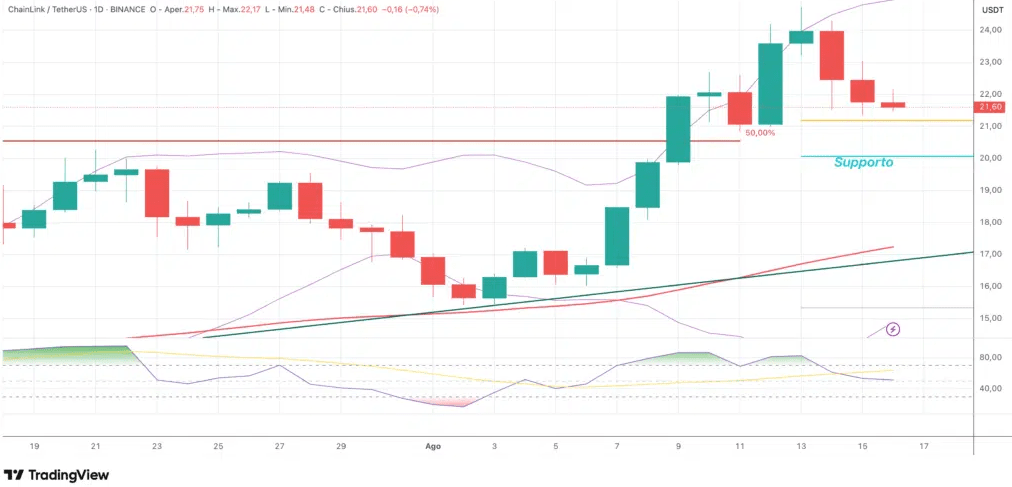
The last three candles, including today's, are negative and indicate a slowdown in upward momentum. LINK is approaching the first support area of 21.10 USDT.
Main support and downside risks
The main support of this vector is at 20 USDT: a loss of this level could push the price towards the range of 17.20 USDT, where the SMA50 and the supportive trendline pass.
If this area is lost, Chainlink could slide down to the 14 USDT area, setting up a broader corrective picture.