The price of XRP is currently around 3.12 USD, consolidating after a strong rally in July that brought it close to its all-time high (3.84 USD).
🔹 Key supports: 3.00 USD – 2.90 USD
🔹 Immediate resistances: 3.20 USD – 3.32 USD
In the short term, XRP faces a sideways consolidation scenario as investors evaluate macroeconomic factors such as inflation in the U.S. and expectations of rate cuts.
📈 Technical outlook:
The pullback from 3.32 USD indicates profit-taking, but as long as it remains above 3.00 USD, the bias remains bullish.
A clear breakout above 3.20 USD could pave the way toward the 3.40 USD zone.
🌐 Fundamental context:
The market maintains positive expectations regarding possible regulatory advances and the arrival of financial products linked to XRP. Analysts like Peter Brandt foresee a movement of up to +60%, which would place the price around 4.47 USD in the coming months.
Current Technical Analysis of XRP
According to the latest technical observations:
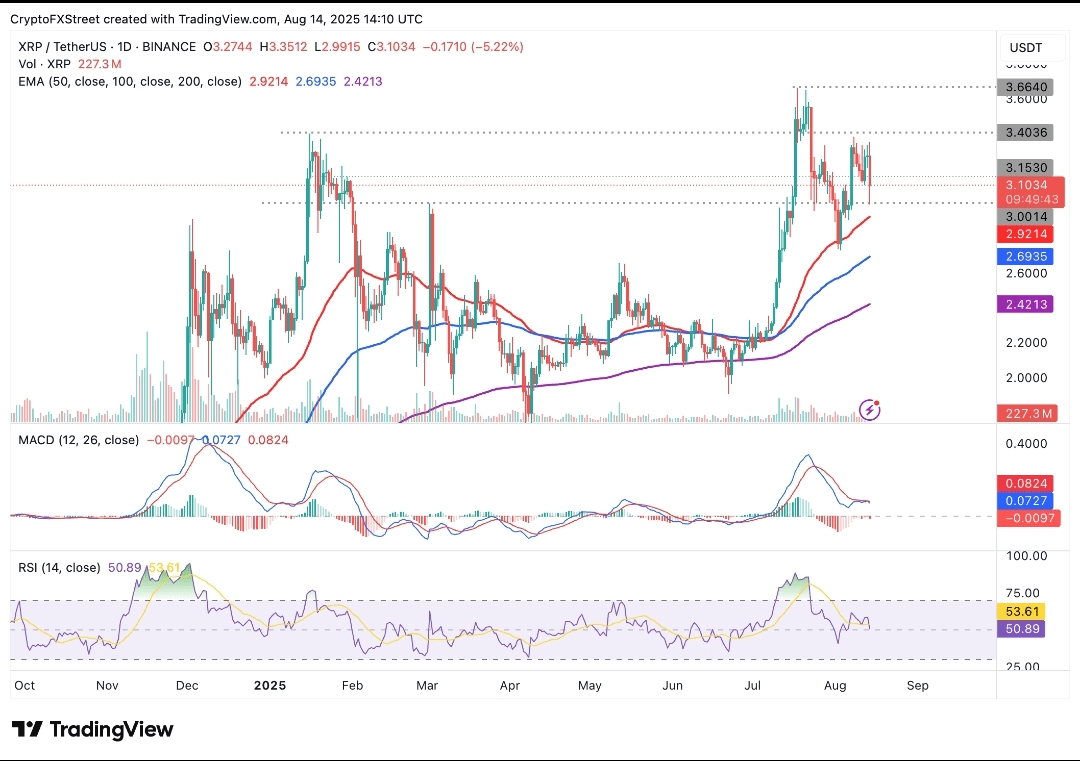
RSI (Relative Strength Index): is in a neutral and descending zone, reflecting a loss of buying pressure. If the RSI continues to drop below the average level, it could open the doors to a correction towards support areas, such as the 50-day moving averages (~2.92 USD).
MACD (Moving Average Convergence/Divergence): still maintains an active sell signal since late July. The MACD line continues below the signal line, while the histogram remains in red, confirming an ongoing bearish trend.
---
Complementary Indicators
On Investing.com, it is reported:
RSI(14): ~54 → Neutral
MACD: ~0.006 → Weak buy signal
Other indicators such as STOCH, ROC, Williams %R, and Ultimate Oscillator show mixed signals, with a neutral-slightly bullish outlook predominating within a generally cautious context.
On TipRanks, the RSI also remains in neutral territory (~51), the positive MACD suggests a slight buy signal, while the ADX shows a neutral bias. The technical consensus is to “Hold.”
---
This technical analysis suggests a market in a consolidation phase, with slight indications of bearish pressure, but without clear signs of a trend change.
Include the chart with RSI and MACD (like the one you see above) along with a brief technical summary.
Technical Analysis – XRP (Ripple)
RSI: In neutral territory (~50), with a sideways to downward trend — no signs of overbought or oversold.
MACD: Still in bearish territory, with the MACD line below the signal and negative histogram; no clear signs of reversal.
XRP is in a consolidation phase, without a defined direction. Buyers maintain pressure, but without sufficient momentum to gain ground. A breakout above resistances or a drop toward key moving averages (e.g., 50 days) will mark the next move.
👉 In conclusion, XRP is on pause after its rally, but retains strength for a new bullish push if it surpasses key resistances.