$BTC Detailed technical analysis of Bitcoin (BTC/USDT) performance as shown in the attached image (15-minute interval):
---$BTC
📊 General trend
The current trend is upward in the short term supported by moving averages.
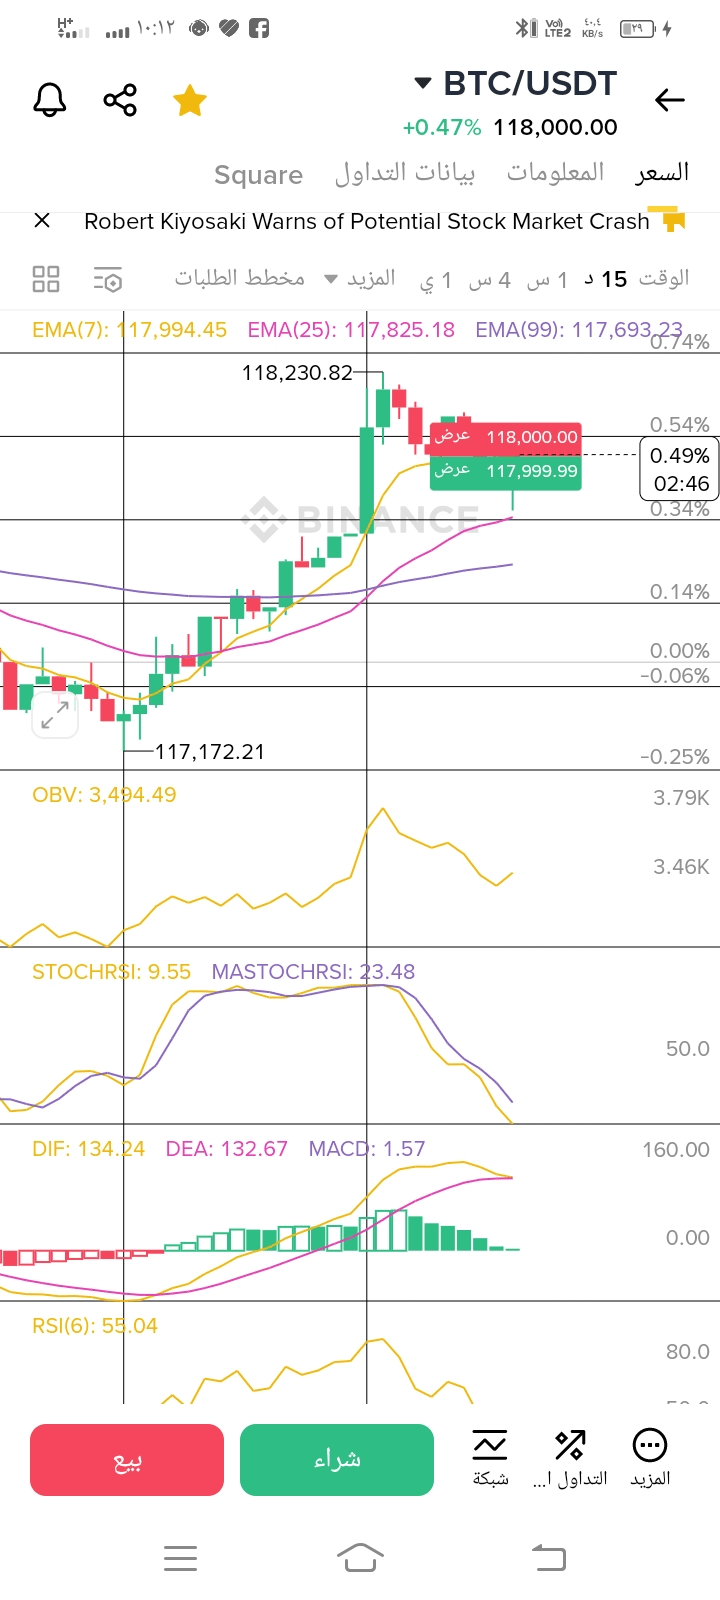
The price is moving at levels of 118,000 USDT after a clear rebound from the low of 117,172 USDT.
---
📈 Moving Averages EMA
EMA7 (Yellow) is above EMA25 (Purple) and EMA99 (Dark Purple) → Short-term positive signal supporting the continuation of the rise.
The price is above all averages, confirming buyer dominance.
---
🔥 Momentum Indicator RSI (Relative Strength Index)
RSI (6) = 55.04 → In the neutral area leaning towards bullish.
Has not reached overbought conditions ➖ There is still room to continue rising before a correction occurs.
---
⏳ Stochastic Stoch RSI
%K variable = 9.55 and %D = 23.48
In oversold areas → A potential bullish reversal is near (short-term entry opportunity).
---
⚠️ MACD
DIF = 134.24 is above DEA = 132.67 → Bullish golden crossover.
The green bars have started to shrink → We may witness a slowdown in upward momentum or preparation for a slight correction.
---
🔄 OBV Indicator (Cumulative Trading Volume)
Increase in OBV → Entry of new buying liquidity and confirmation that the upward movement is supported by trading volume.
---
🎯 Nearby support and resistance zones
Level Description
117,700 – 117,800 First support
117,200 Strong support
118,230 – 118,300 Current resistance
118,800 – 119,000 Next resistance
---
✅ Technical outlook (short-term)
As long as the price is above 117,700, it is expected:
Attempting to break 118,230 → then 118,800
If 117,700 is broken, we will see a correction towards 117,200
---
📌 Recommendation
📥 Buy at support: 117,700 – 117,800
🎯 First target: 118,300
🎯 Second target: 118,800
⛔ Stop loss below: 117,500
