
According to a new technical analysis, Bitcoin and the cryptocurrency market as a whole may be reflecting historical post-halving cycle patterns. Although the market has previously experienced growth throughout July and August, historical fractals suggest a potential collapse in September, followed by a price surge to the cycle peak at the end of the year.
September Proves Risky for the Bitcoin and Cryptocurrency Market
A recent post on social media X by cryptocurrency analyst Benjamin Cowen highlighted a recurring pattern in Bitcoin's price movements, which may have significant implications for the market in the coming months. His analysis shows that Bitcoin consistently follows post-halving cycles, exhibiting pronounced seasonal price fluctuations, particularly around July, August, and September.
The chart shared by Cowen shows that in previous cycles, Bitcoin typically experiences price increases in July and August, fueling strong market optimism and sentiment. However, each such instance is accompanied by a downturn in September, leading to a correction before reaching the final cycle peak, which usually occurs in the last quarter of the year.
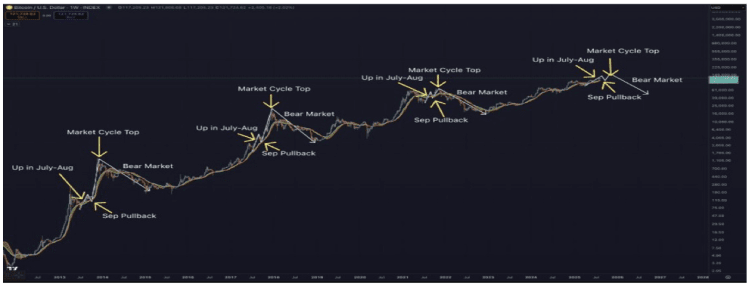
According to the analysis, this recurring structure not only appears in a single cycle but has manifested in several previous cycles, reinforcing the expert's argument that history may be repeating itself. In the years 2013, 2017, and 2021, Bitcoin's price movements closely followed this pattern, demonstrating strength in mid-summer and weakening in September.
After each previous price surge to a peak, each cycle is ultimately followed by a prolonged bear market phase, during which pricing adjusts sharply from the peak. Based on Cowen's report, the current cycle appears to be unfolding in the same manner, as Bitcoin has shown strength in July and August this year, raising concerns that the September pullback may be approaching.
BTC Cycle Indicates the Market Still Has Plenty of Room to Grow
A new technical analysis from cryptocurrency market expert TechDev also reveals a recurring pattern in Bitcoin's long-term price cycles, arguing that, contrary to popular belief, the current market may still be far from its peak. This analysis, supported by historical charts of BTC's performance, shows that every market peak occurs about 14 months after a specific cycle signal.
The chart outlines several Bitcoin cycles starting from 2011, with peaks and troughs clearly marked by green and red indicators. Each bullish phase is followed by a significant correction and then a recovery accumulation phase. The data also indicates that each cycle peak often aligns with a measurable timeframe of about 420 days.
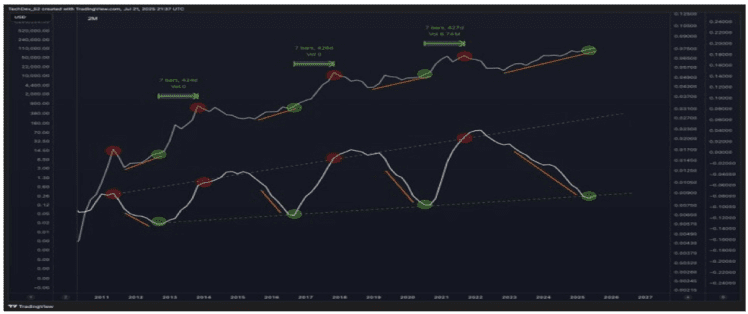
Based on this pattern, current forecasts suggest that Bitcoin still has room for growth. The most recent green signal on the chart indicates that the market may have emerged from the correction phase. If historical patterns hold, this could mean the market is entering a prolonged growth phase rather than nearing a weakening phase.