
Bitcoin is trading at $117,757 after a week of volatility with a new all-time high above $124,000. The current price reflects a daily increase of 0.51% and a 0.68% rise over the past seven days. Despite short-term hesitation, analysts believe that the overall trend remains intact, supported by technical data and on-chain data.
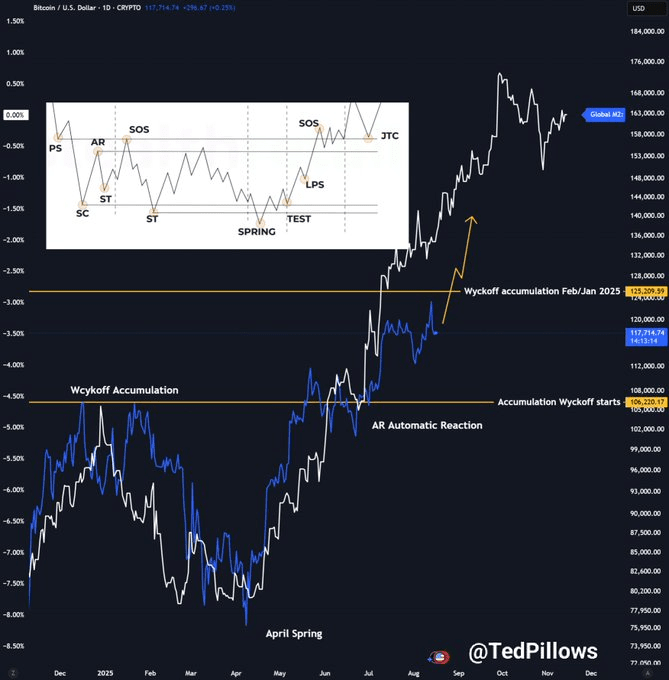
The recent downturn occurred after the U.S. Producer Price Index (PPI) was released, causing a short-term adjustment in risk assets. However, Bitcoin's chart structure still shows strength. According to Ted, BTC is tracking a Wyckoff Accumulation pattern that began in early 2025, with the 'spring' phase forming in April and steady growth since then.
Breaking through the $124,000 mark is not seen as a peak but rather as part of the 'Strength Signal' phase. The analyst added: 'I still don’t think $124,000 was the peak,' citing the increase in global M2 as a driver for continued upward momentum.
Wyckoff Model and Global Liquidity Correlation
The chart shared by Ted overlays Bitcoin's price on global M2 money supply, a measure of liquidity. Since the beginning of 2025, M2 has been on an upward trend, consistent with BTC's rise. This comparison shows that as liquidity increases, Bitcoin may continue to benefit.
The Wyckoff structure displayed on the chart supports this view. It identifies key phases such as accumulation, growth, and breakout - all of which Bitcoin has adhered to this year. If this pattern continues, the next move could take BTC to $160,000, according to the forecast line.
Although PPI data temporarily disrupted the uptrend, Bitcoin remains above key support zones, indicating that buyers are still in control. The M2 bullish trend could further support the price increase.
Technical Indicators Show a Pause in the Uptrend
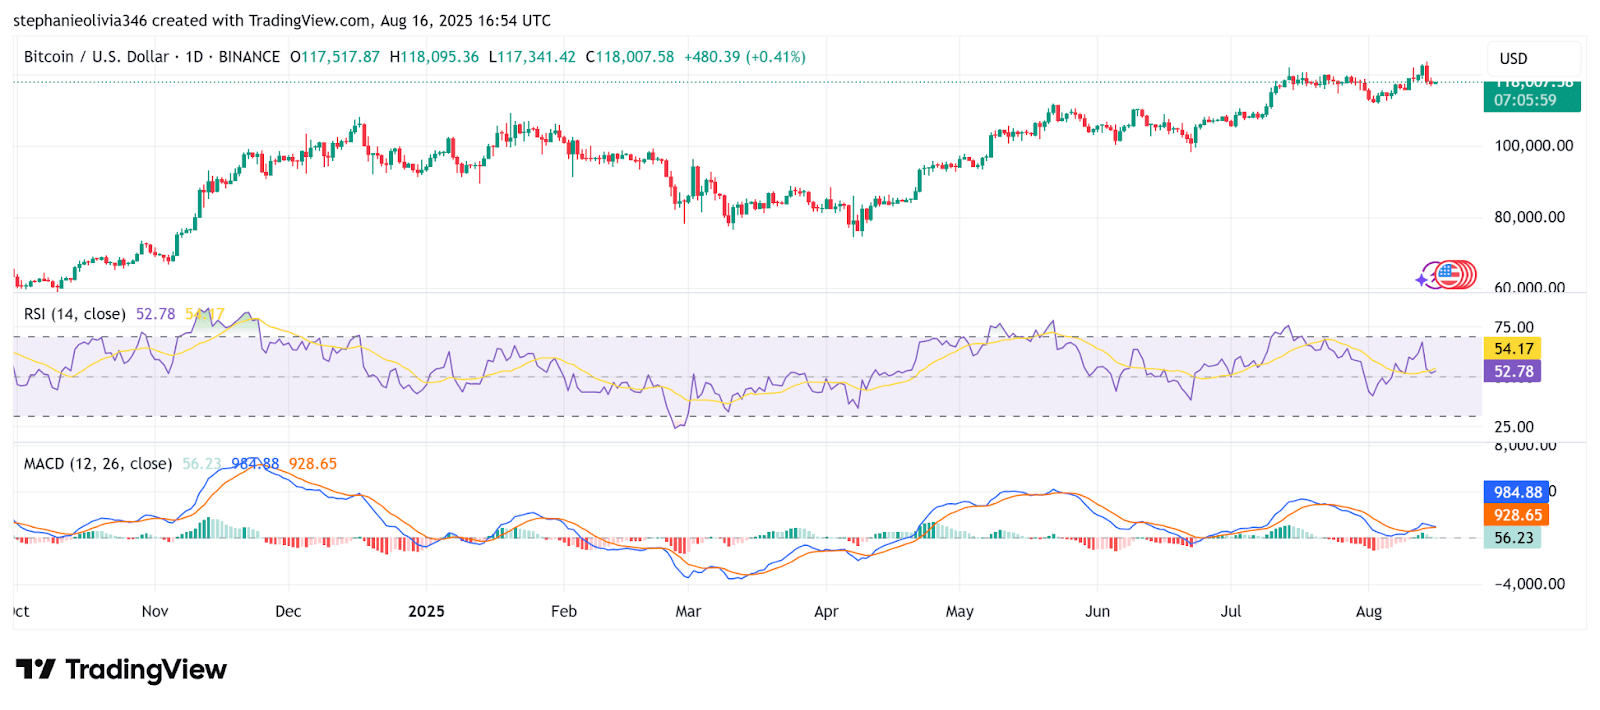
The daily chart of BTC shows consolidation near recent highs. The Relative Strength Index (RSI) is at 52.73, indicating neutral momentum.
The Moving Average Convergence Divergence (MACD) is above the signal line, indicating a slight bullish crossover, although the histogram remains flat. These indicators confirm that the market is pausing, with no reversal signals or strong trend acceleration.
Short-term developments will depend on whether BTC can maintain the current level and break through recent highs. Price movements in the coming sessions may determine whether a new bullish phase will begin or if it will continue to consolidate.
On-Chain Support Levels Confirm Holder Interest
On-chain analyst Ali Martinez shared a heat map of costs showing that BTC's strongest short-term support is between $117,459 and $117,606. This zone contains approximately 72,900 BTC, indicating high holder interest. A secondary support band lies between $114,412 and $114,555, with 56,201 BTC accumulated.
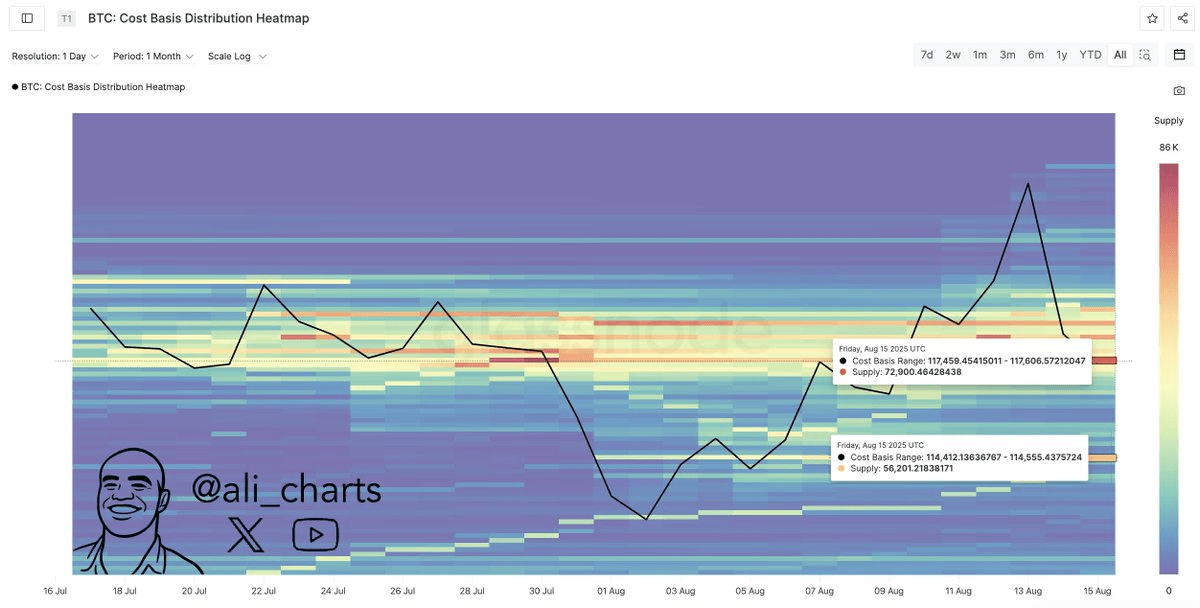
These support zones reflect price levels where large volumes of BTC were traded, making them potential areas for buyers to defend. The analyst notes that as long as BTC remains above $117,500, 'this structure indicates ongoing support from recent buyers.'
The next big move of Bitcoin could be driven by how it operates around these important thresholds. Currently, the bullish trend remains intact, with traders waiting for a breakout above $124,000 and beyond.

