

The current picture on the daily timeframe shows an interesting phase for the asset:
🔹 Formation — the price has exited a descending triangle and is consolidating above the resistance line. This indicates a possible end to the prolonged decline and the beginning of a local uptrend.
🔹 Ichimoku ☁️ — the candles have broken through the cloud, and now the price is testing the upper boundary. A breakout and consolidation above the level of $0.129–0.13 may confirm the strength of the buyers.
🔹 MA (7/25/99) 📈 — moving averages are beginning to converge, forming a possible 'bullish crossover'. This is a positive signal for continued growth.
🔹 SAR 🔵 — the indicator signals a change in the local trend to bullish.
🔹 Levels:
Support: $0.118 – $0.120 (key holding zone).
Resistance: $0.138 – $0.145 (nearest growth target).
Upon breaking $0.145, the next target may be around $0.16–0.18 🚀.
📌 Summary: the market shows signs of accumulation and an upward trend. Consolidation above $0.13 will pave the way for stronger growth. However, a pullback below $0.118 keeps the risks of returning to sideways movement.
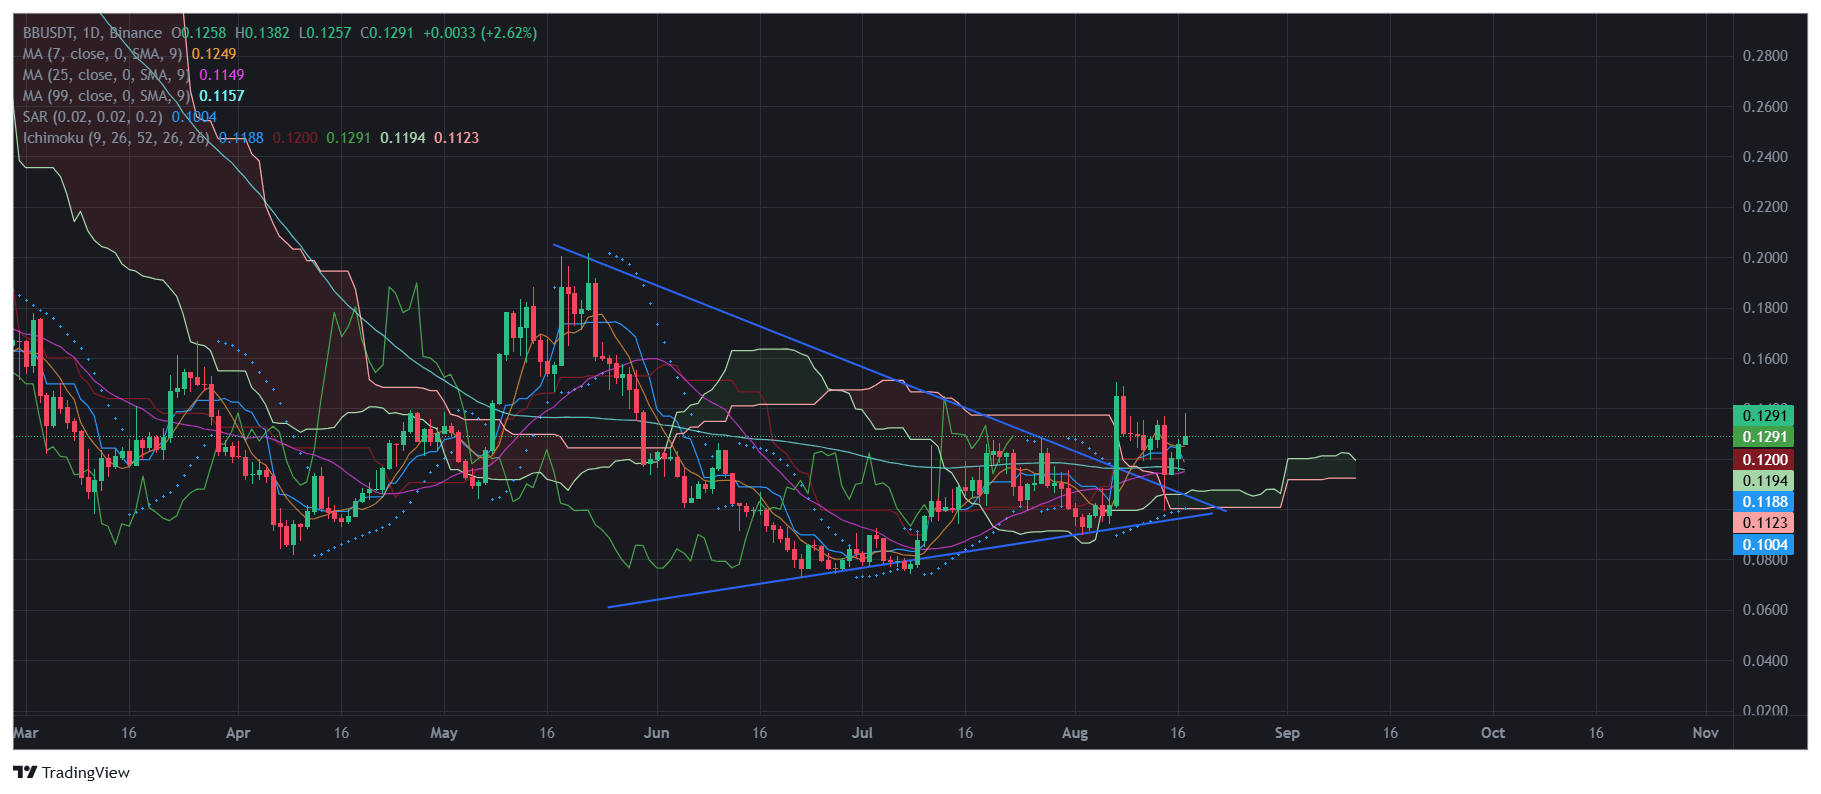
🔥 Verdict: bulls are strengthening their positions, the breakout scenario looks prioritized.
🏡BounceBit
RWA: real assets in Web3
Tokenization opens up: Access to traditional assets (real estate, bonds) on the blockchain. Portfolio diversification with high liquidity. Connecting off-chain economy with DeFi opportunities.
🌉
On-chain-off-chain bridge
BounceBit erases boundaries, offering a safe and transparent way to increase returns. Your assets work simultaneously in multiple dimensions!
🔥
Why is BounceBit a game changer? BTC protection for unparalleled security. CeDeFi products for beginners and pros. RWA and LCTs for hybrid strategies.
💫
BounceBit is your ticket to the world of financial freedom!
