

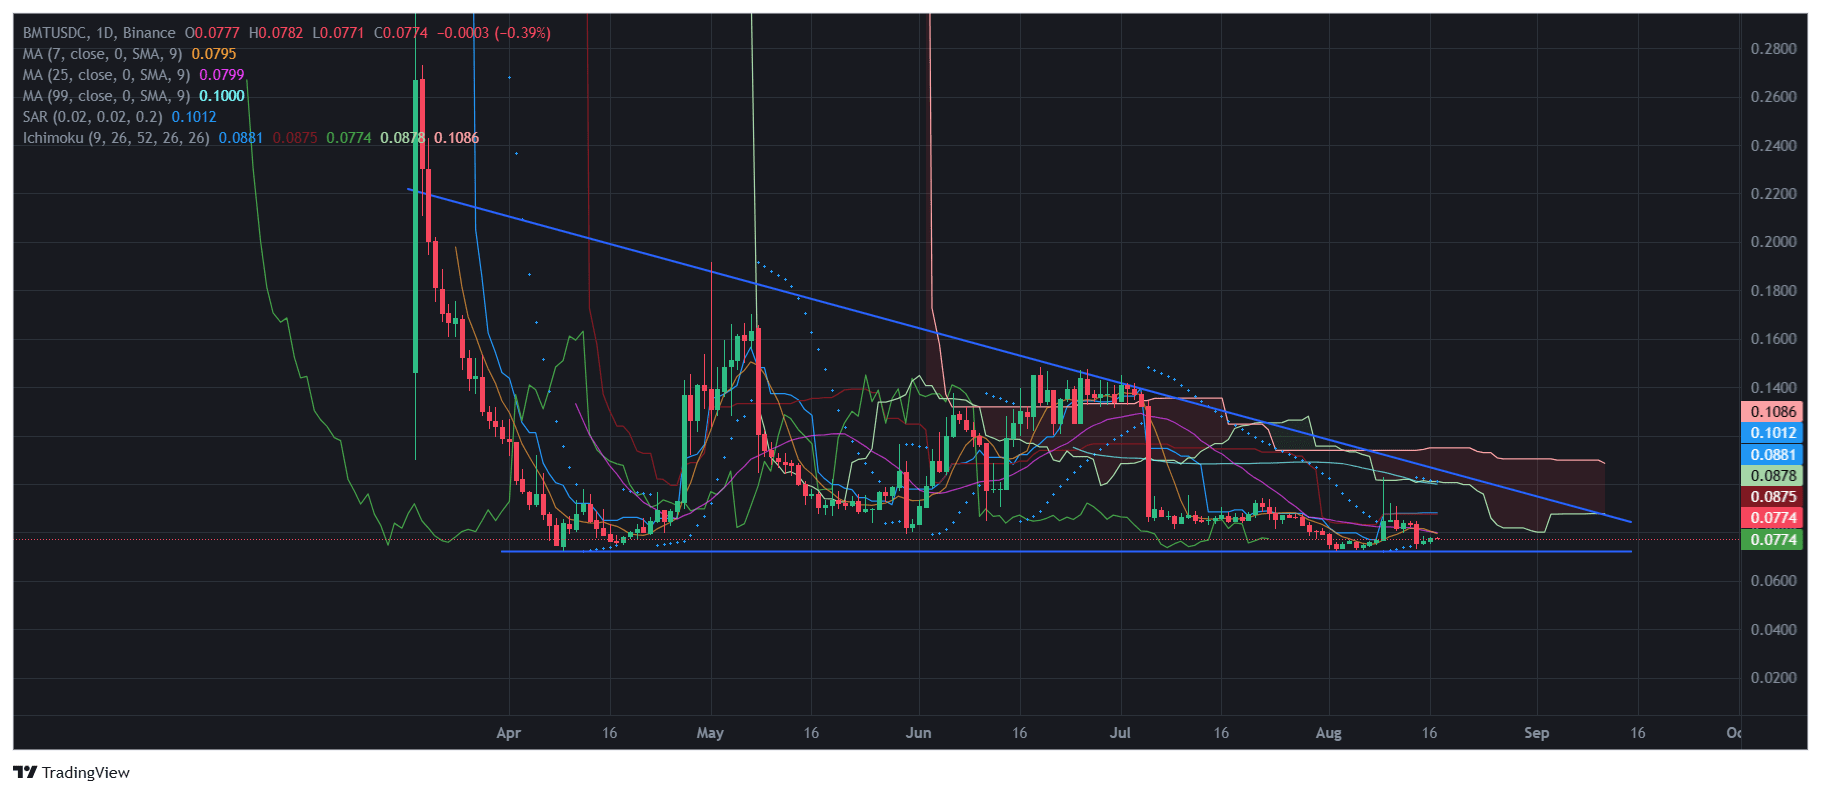
📉 Analysis BMT/USDC (1D)
The current situation for the asset looks ambiguous, but there are key areas to pay attention to 👇
🔹 The global trend remains bearish, the price is moving under the resistance line and the Ichimoku cloud ☁️. This indicates seller dominance.
🔹 Support: $0.075–0.077 (current holding zone). Losing this level will open the way to $0.065–0.068 ❗️
🔹 Resistance: $0.088 – $0.10. A breakout and consolidation above $0.10 will give a chance for recovery to the $0.125–0.13 zone 🚀.
🔹 MA (7/25/99) — the price is squeezed under the moving averages, there are no bullish signals yet.
🔹 SAR 🔵 — points are above the price, confirming the downtrend.
🔹 Ichimoku — the price is under the cloud, the nearest resistance is around $0.088.
📊 Conclusion: the asset is at critical support. As long as buyers hold $0.077, the chance for a rebound remains. However, the overall background is bearish 🐻.
⚡️ Scenario:
Long — only after consolidation above $0.088–0.09 with targets of $0.10 / $0.125.
Short — on breaking down $0.075, target $0.068 and below.
💡 Summary: the market is in a phase of consolidation at the bottom. The coming days will show — either a breakout upwards and the start of recovery, or a new downward impulse.
@Bubblemaps.io #Bubblemaps $BMT
🌐 Powered by $BMT 🪙
BMT— the native token of Bubblemaps, providing access to premium features:
🤖 AI-clustering for deep analytics
📊 Historical tracing
🗳 Governance through Intel Desk
Holders of BMT receive not just a tool, but a key to onchain intelligence — the opportunity to participate, direct, and earn alongside the growth of Bubblemaps 🚀.

