In the crypto world, a day is like a year in the human world—today's 11% surge in OKB, is it the main force pushing prices up to sell, or the start of a new market cycle?
1. Market Review: Violent surge, but insufficient volume
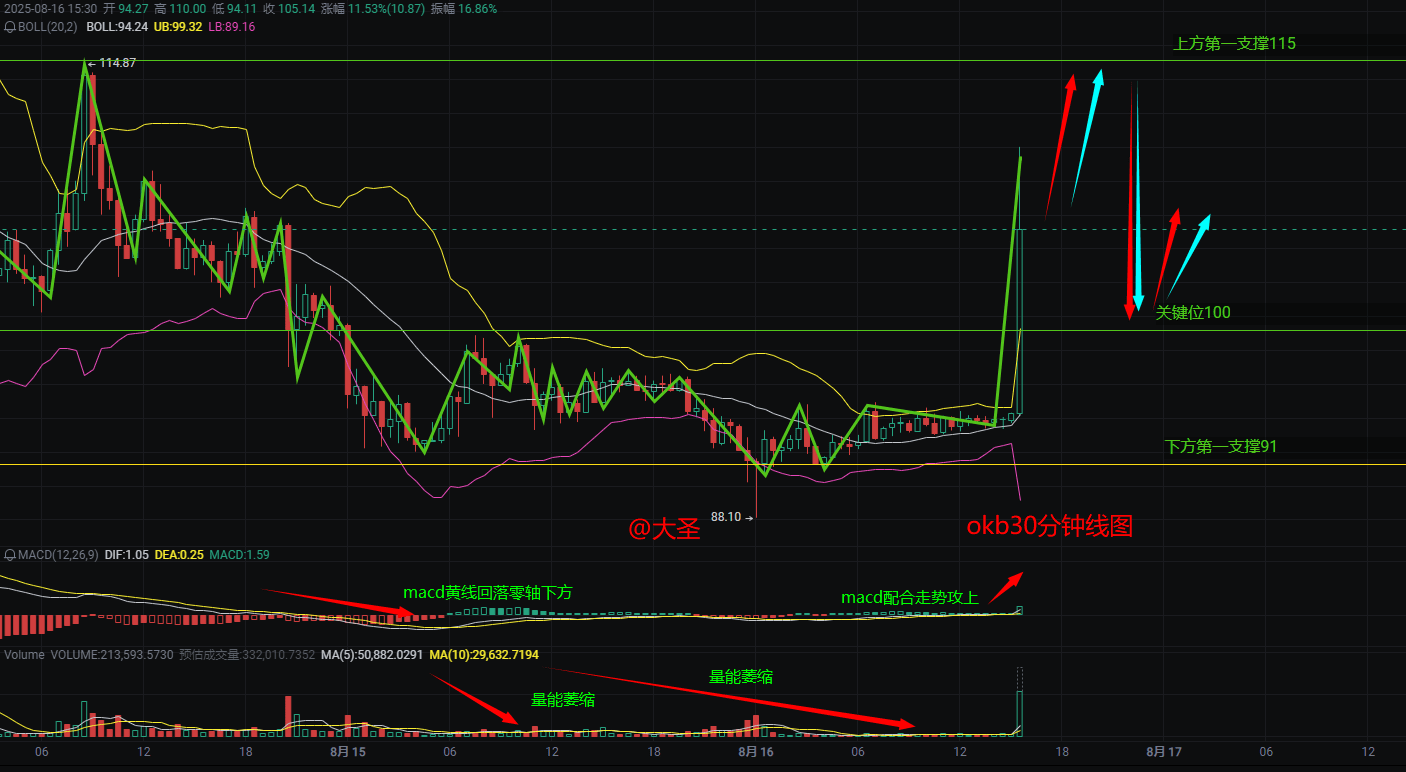
Today, OKB's 30-minute candlestick chart produced a large bullish candle, surging from 94 to 110 in one go, an increase of 11.5%, but then fell back to around 105. From a technical perspective:
Bollinger Bands: The price took off from the middle band at 94, hitting the upper band at 99 before encountering resistance, indicating short-term overbought conditions. MACD: Although there's a golden cross, the yellow line (DIF) is still below the zero line, indicating that the bulls are not strong enough. Volume Shrinkage: Trading volume decreased during the rise, a typical 'volume-price divergence', indicating insufficient chasing funds.
Key Levels:
Support Levels: 100 (psychological level), 94 (starting point), 91 (first support below)
Resistance Levels: 110 (today's high), 115 (previous high resistance)
2. News Aspect: Good news or a smokescreen?
OKX Exchange Dynamics: Recently, OKX announced a new round of the Jumpstart project, which may drive short-term demand for OKB. Market Sentiment: After BTC stabilized at 30,000, some funds began to rotate into platform tokens. Potential Risks: OKB has not announced any significant ecological progress recently; this surge seems more like a technical rebound rather than being driven by fundamentals.
Personal Opinion:
“This market reminds me of the surge in OKB back in May—similar sudden spikes, but followed by a lack of sustained buying, resulting in a drop back to the starting point within a week. Today's volume is even weaker than that time, so be careful of being lured in!”
3. Operational Strategy: Short-term speculation, long-term observation
Aggressive Traders: If it pulls back to 100 without breaking, a small position can be taken long, target 110-115, stop loss below 100. Conservative Traders: Wait for stabilization above 115 before considering a chase, otherwise it's better to miss out. Spot Traders: If it breaks below 94, it may pull back to 91 or even 88, don't rush to catch the bottom.
Case Reference:
Last month, LINK also had a sudden large bullish candle, and the next day it was directly engulfed by a bearish candle, leaving all those who chased high trapped. Will today's candlestick for OKB follow the same script?
Is this surge in OKB driven by the main force's charting or the start of a new trend? At 8 PM tonight, I will analyze the flow of main funds in the live room, click to follow, don’t miss the key signals!

