1. Current Price and Trend
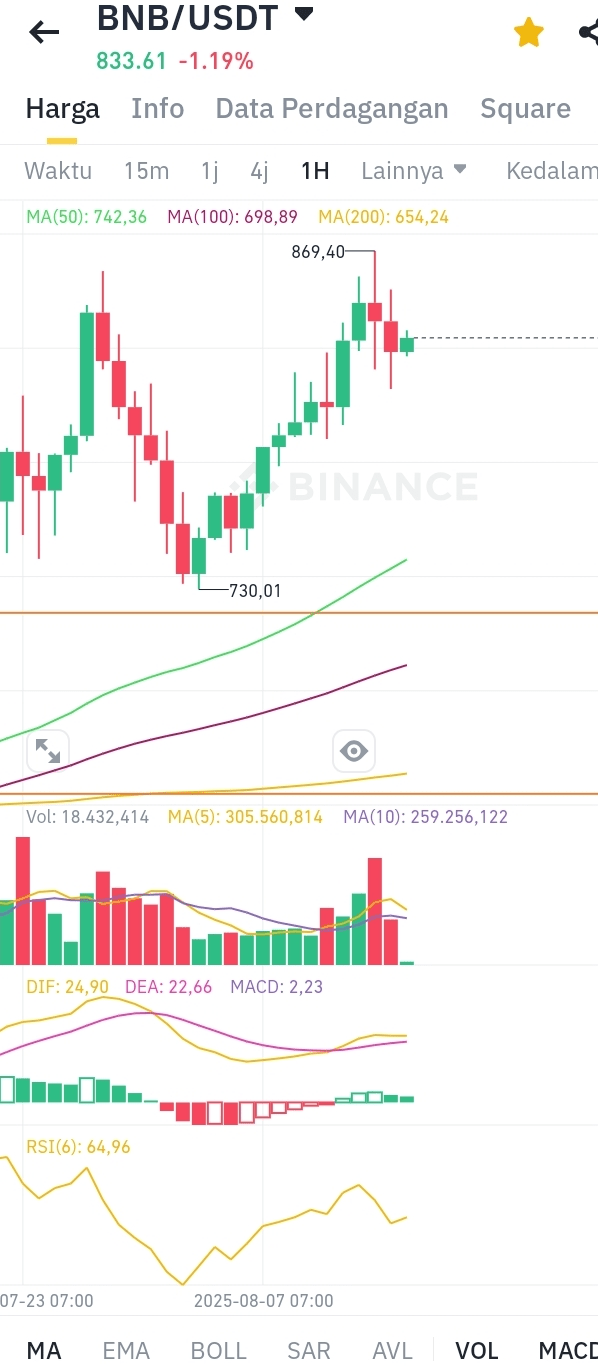
Last Price: 833.61 USDT (-1.19%).
Moving Averages (MA):
MA(50): 742.36 (dynamic support).
MA(100): 698.89 (medium-term support).
MA(200): 654.24 (long-term support).
Trend Indication: Price above MA(50), MA(100), and MA(200) indicates a medium-term bullish trend, but short-term correction (-1.19%) should be watched.
2. Volume and Liquidity
24-Hour Volume: 18.43 million BNB.
Volume MA(5): 305.560 (higher than MA(10): 259.256), indicating increased buying activity recently.
3. Key Indicators
MACD:
DIF (24.90) > DEA (22.66), with positive histogram (2.23). Signal: Bullish momentum still exists, but weakening.
RSI(6): 64.96 (approaching overbought >70). Signal: Potential minor correction before continuing up or consolidation.
Support/Resistance Levels:
Support: 730.01 (psychological), 735.33 (MA50), 688.32 (MA100).
Resistance: 876.37 (last high).
Trading Strategy
1. Bullish Scenario (Continue Uptrend)
Entry:
If the price bounces from MA(50) (~740) or 730.01 with high volume confirmation.
Alternative: Breakout above 876.37 with high volume.
Target: 900 (psychological resistance), then 950.
Stop Loss: Below 730.01 or MA(100) (~698).
Risk Management: Use a risk-reward ratio of 1:2 (example: SL 10 USDT, TP 20 USDT).
2. Bearish Scenario (Correction or Reversal)
Entry:
If RSI(6) >70 and the price is rejected at 876.37, or MA(50) with high volume.
Target: 698.89 (MA100), then 654.24 (MA200).
Stop Loss: Above 876.37 or MA(50) if shorting.
Note: Be cautious of false breakdowns in the MA area.
3. Scalping (15M-1H)
Tools: Use Bollinger Bands (not visible in screenshot) for volatility identification.
If the price touches the lower band + RSI <30: Buy.
If the price touches the upper band + RSI >70: Sell.
Target: 5-10 USDT per trade.
4. Use of Additional Indicators
Parabolic SAR: If the SAR point is below the candle (buy signal) or above (sell signal).
Volume: Confirm breakout/drop with volume above MA(5).
Recommendation
Priority: Monitor price reaction at 876.37 (resistance) and 730.01 (support).
Avoid FOMO: If RSI is >70, wait for a correction before new entry.
Macro News: Check updates on Binance Smart Chain (BSC) or BNB burn that could affect price.
Action Summary
Condition
Action
Target
Stop Loss
Bouncing from 730
Buy
876 > 900
<730
Breakout 876
Buy (confirmation)
900-950
<850
Rejected at 876
Sell/Short
740 > 698
>876
Use a maximum risk of 2% per trade and adjust according to market volatility.