
Notcoin has corrected nearly 14% in the past week and 28% in the last three months. The coin has failed to integrate into the overall market uptrend, and currently sits just 19.4% above its all-time low.
Strong selling near these levels is rarely a bullish signal, but upon closer inspection, we see two metrics that could still influence the outcome if they favor Notcoin.
The Inflow of Money into the Exchange Shows Panic Selling Despite Whale Purchases
In the past seven days, the money flowing into the exchange has increased by 6.5%, bringing the total exchange balance to 30.39 billion NOT. This is a clear sign of selling pressure from individual investors, especially as Notcoin's price hovers near its all-time lows.
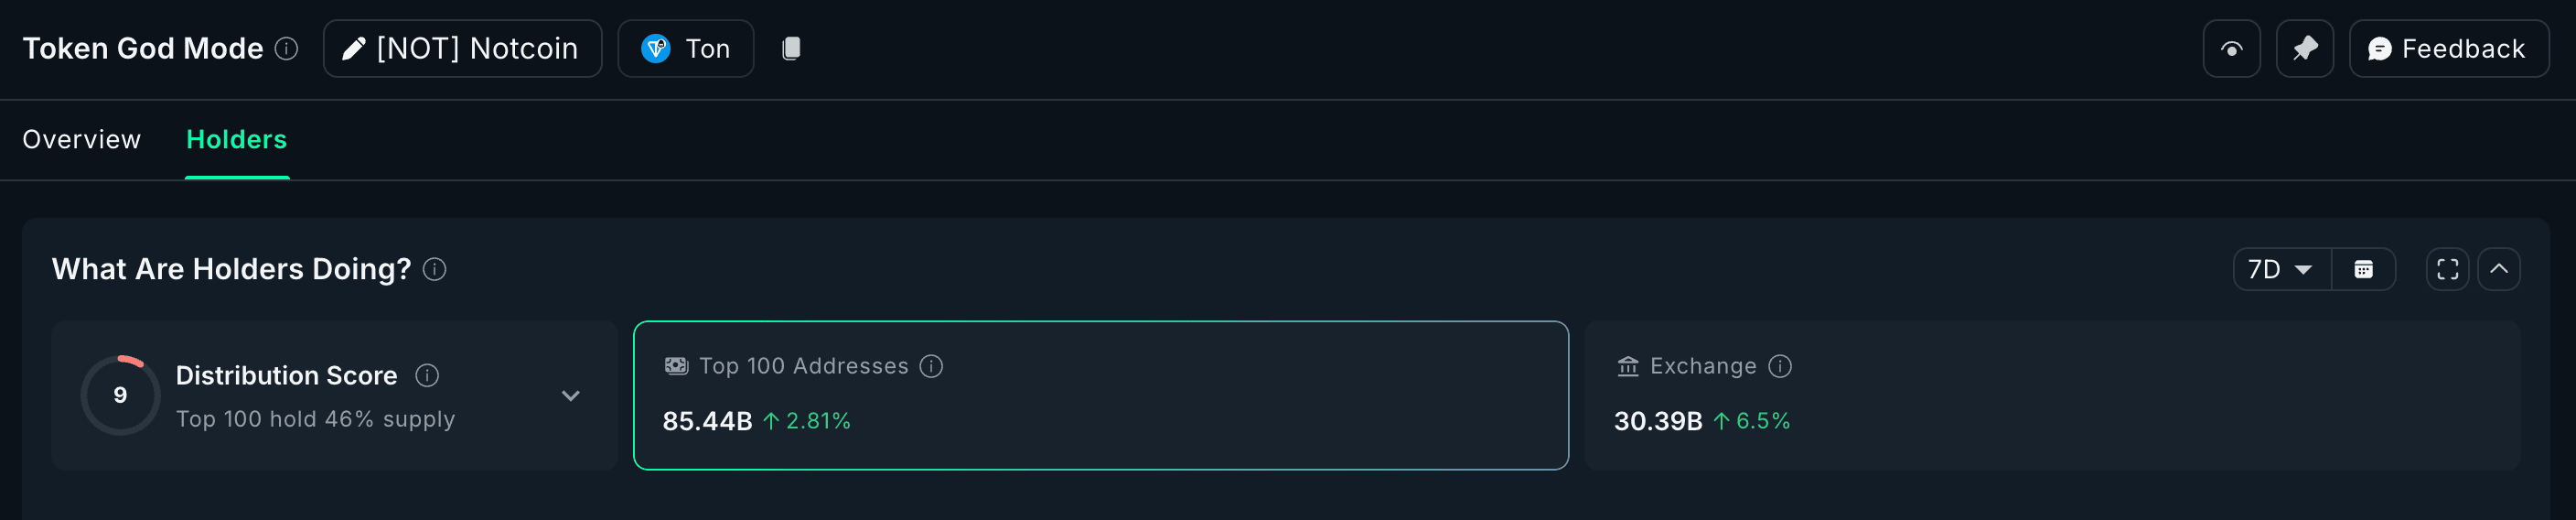
Interestingly, the top 100 addresses are net buyers during this period. If these large holders continue to accumulate while the money flow into the exchange slows down and eventually shifts to outflows, market sentiment could begin to change.
However, currently, selling pressure near the lows remains the dominant force, forcing buyers to defend. On the daily timeframe, selling is also increasing, signaling that the sellers are still controlling the upward momentum.
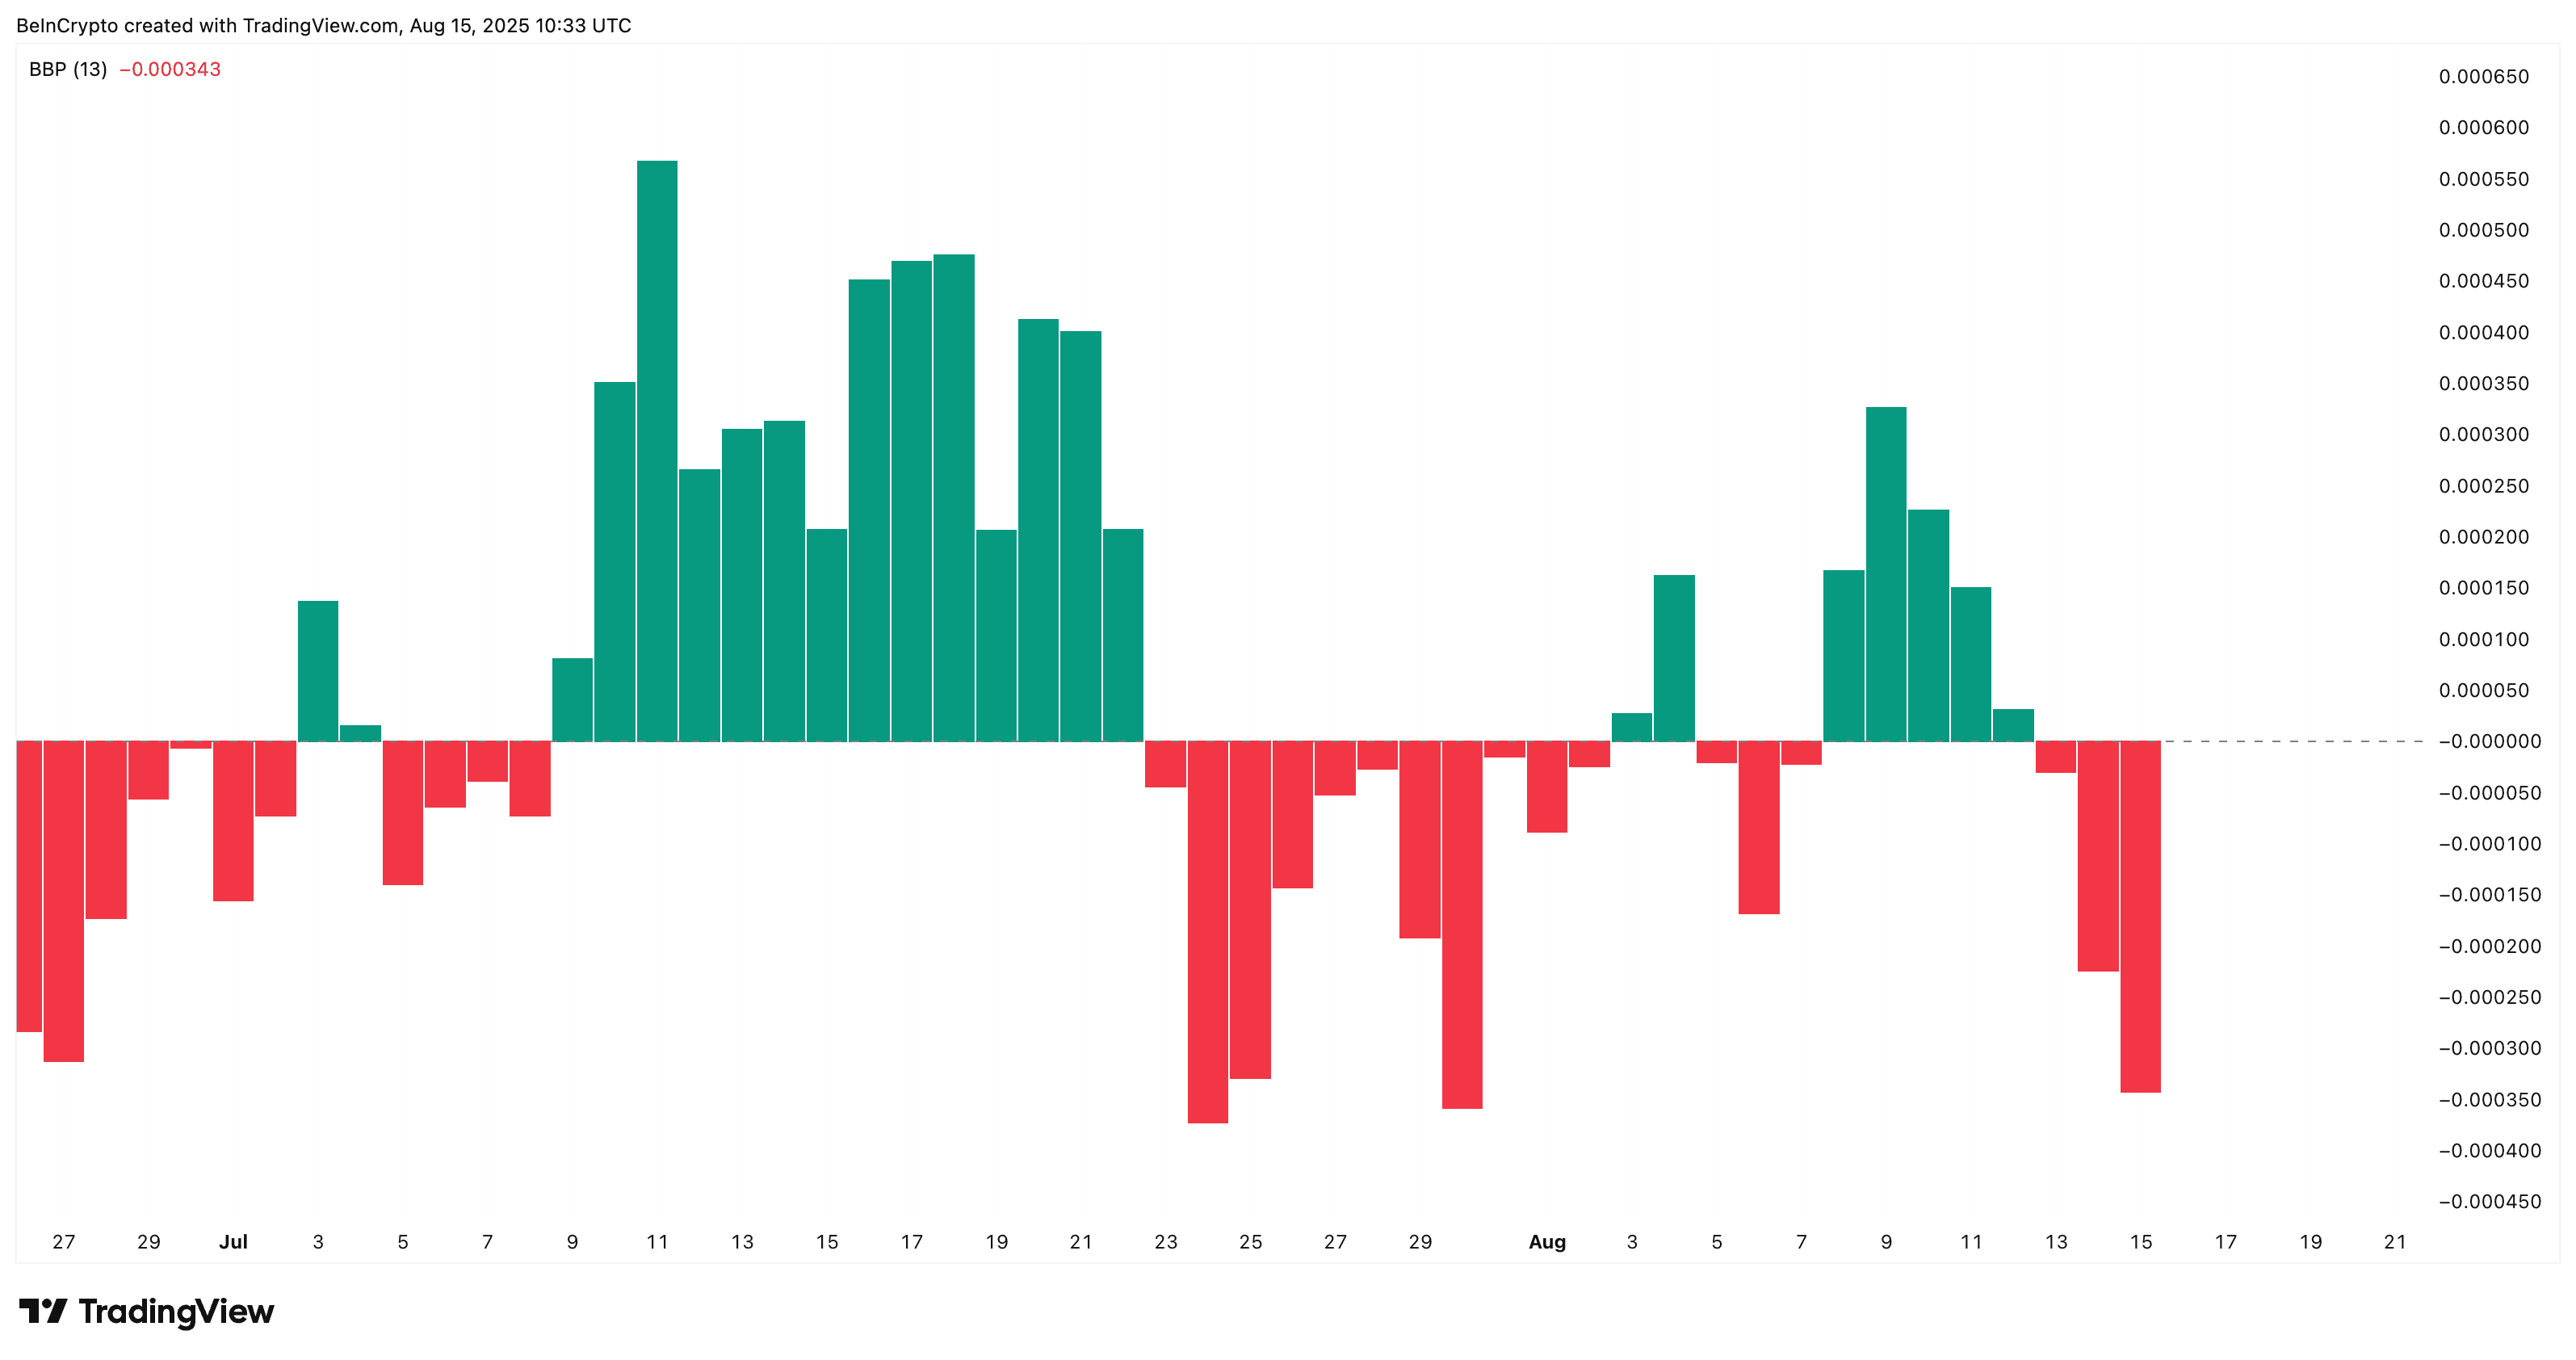
The Bull-Bear Strength Indicator is a technical analysis tool used to measure buying and selling pressure in the market.
The technical setup of Notcoin is issuing a serious warning signal. On the 4-hour chart, several death cross points have formed in recent sessions, each marking a significant bearish level.
The next crossover is approaching — the 100-period EMA line, also known as the Exponential Moving Average (the light blue line), is nearing a crossover below the 200-period EMA line (the dark blue line).
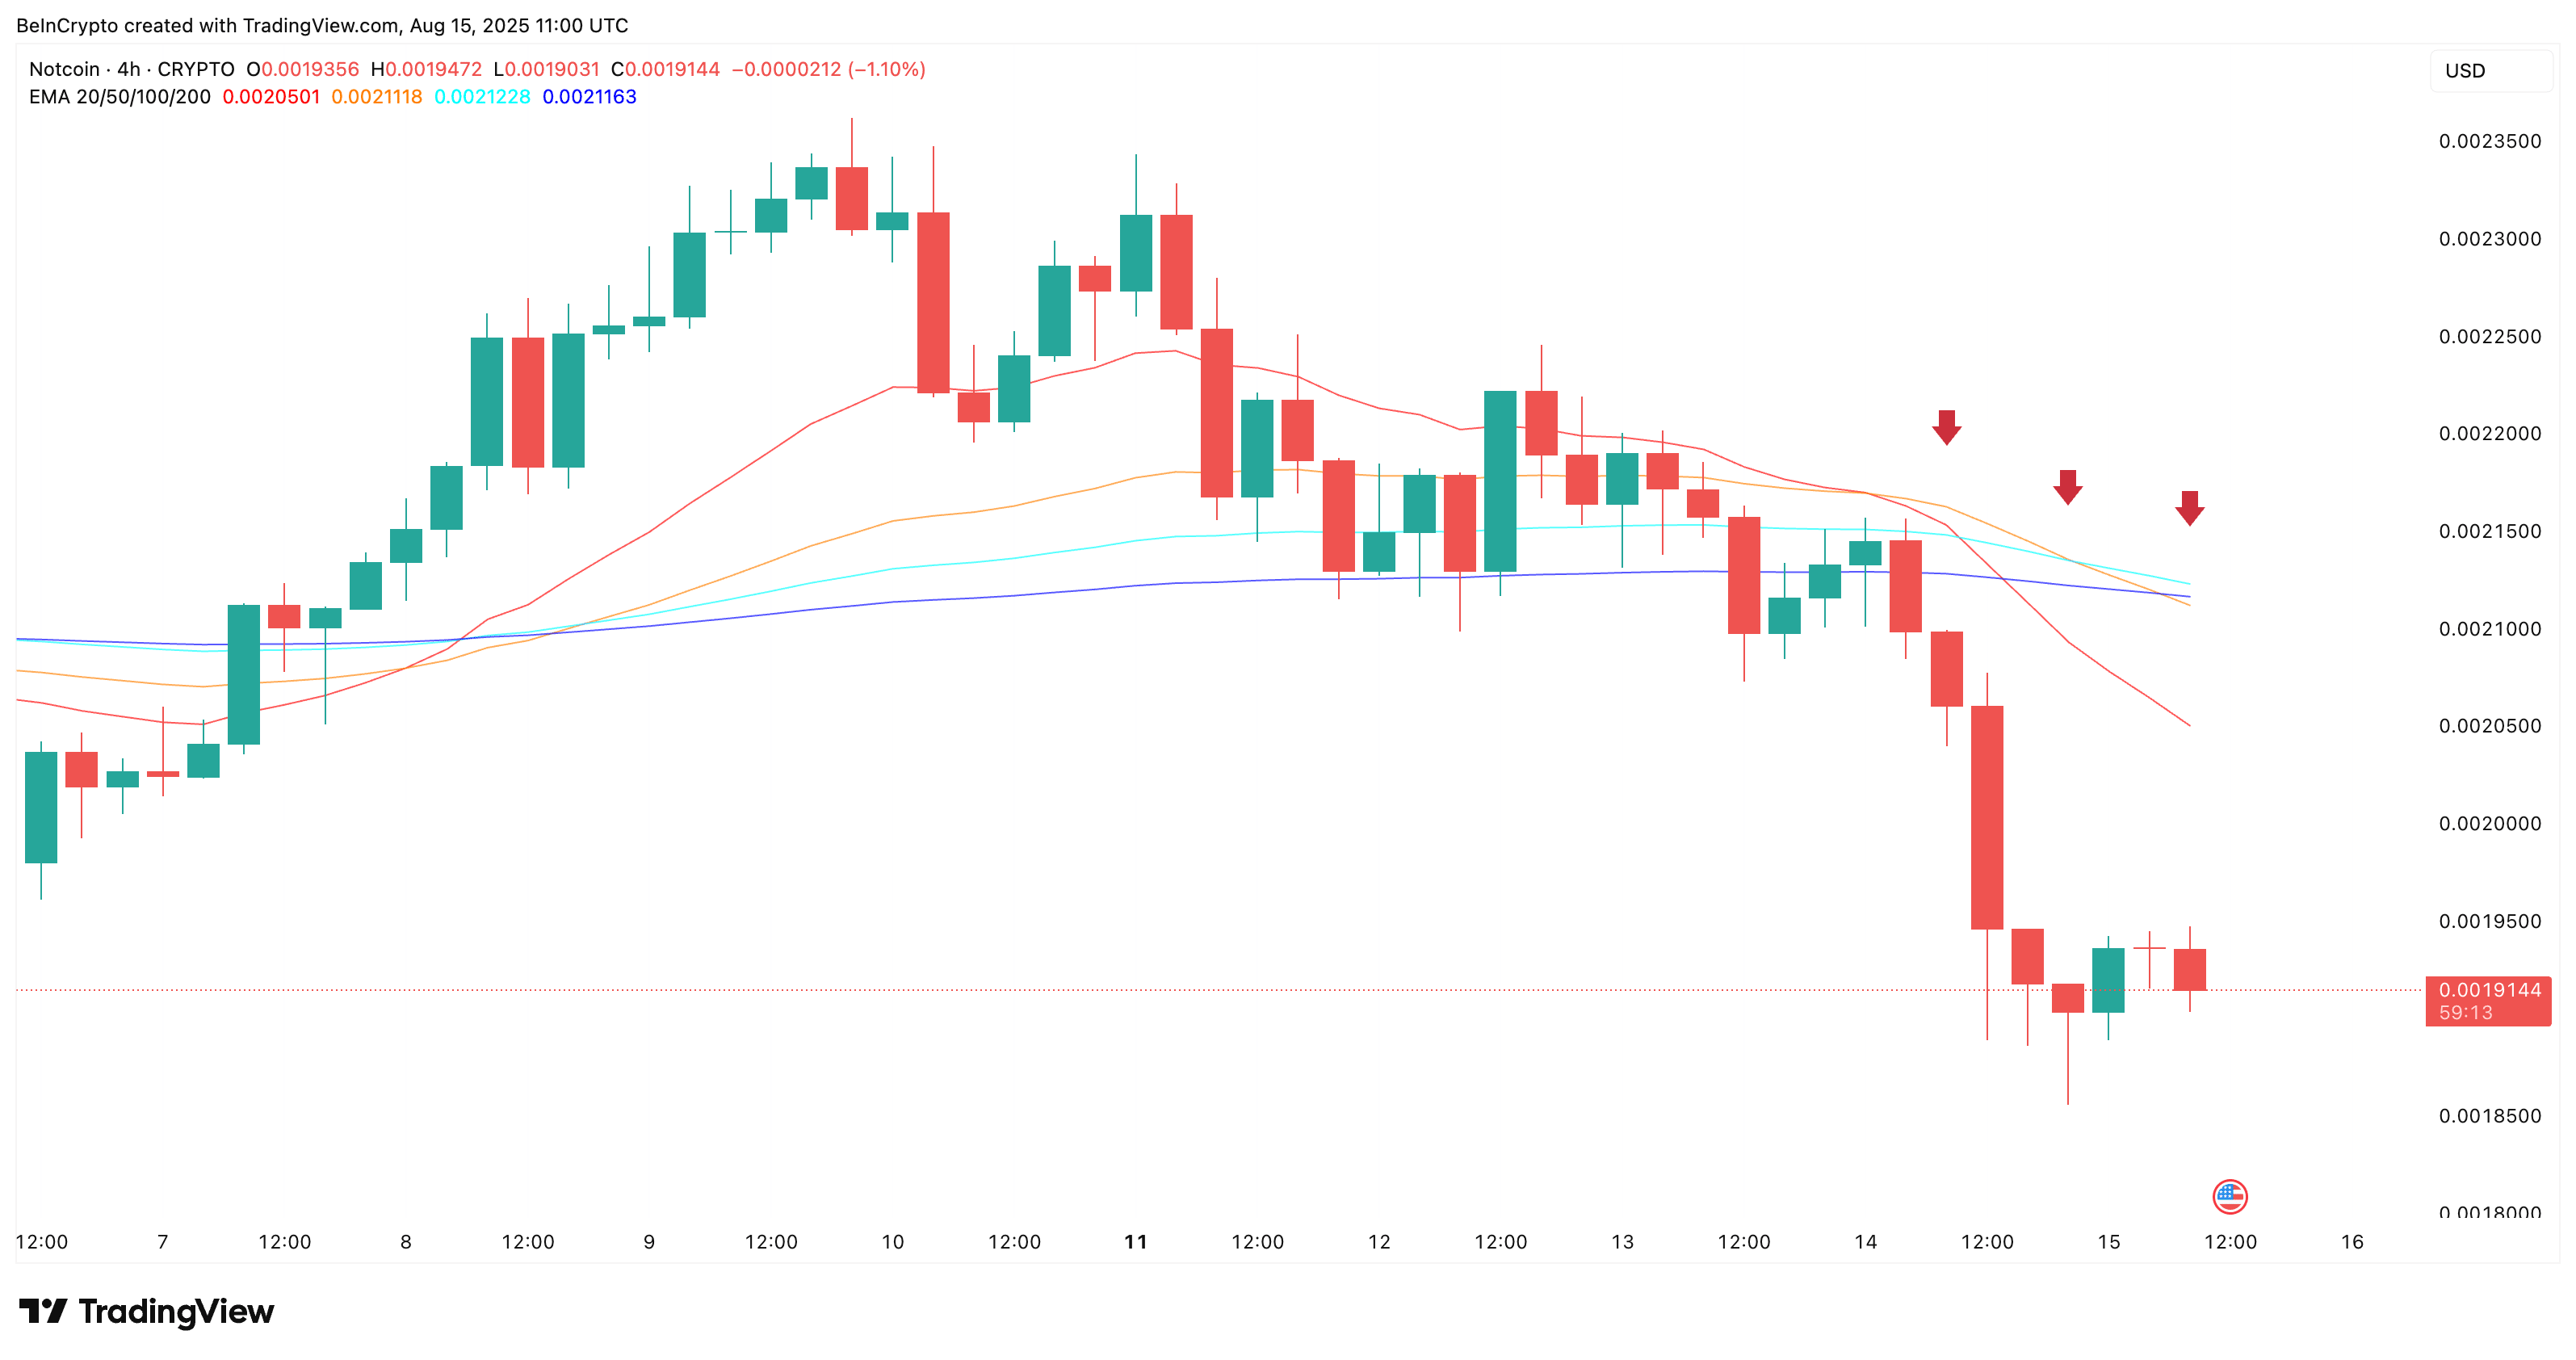
If this crossover is confirmed while the money flow into the exchange remains high, it could accelerate the process of testing the $0.0018 level or establish a new record low. This chart structure reflects the same bearish momentum seen before previous declines, reinforcing short-term risks.
The Exponential Moving Average (EMA) tracks price trends but places greater emphasis on recent data. A crossover occurs when a short-term EMA crosses a long-term EMA. It signals a potential trend change.
A Remaining Bullish Divergence on Notcoin's Price Chart
The only positive sign on the chart comes from the Chaikin Money Flow (CMF). While the price made lower lows from August 5 to August 14, the CMF made higher lows — an early sign that selling pressure may be easing.
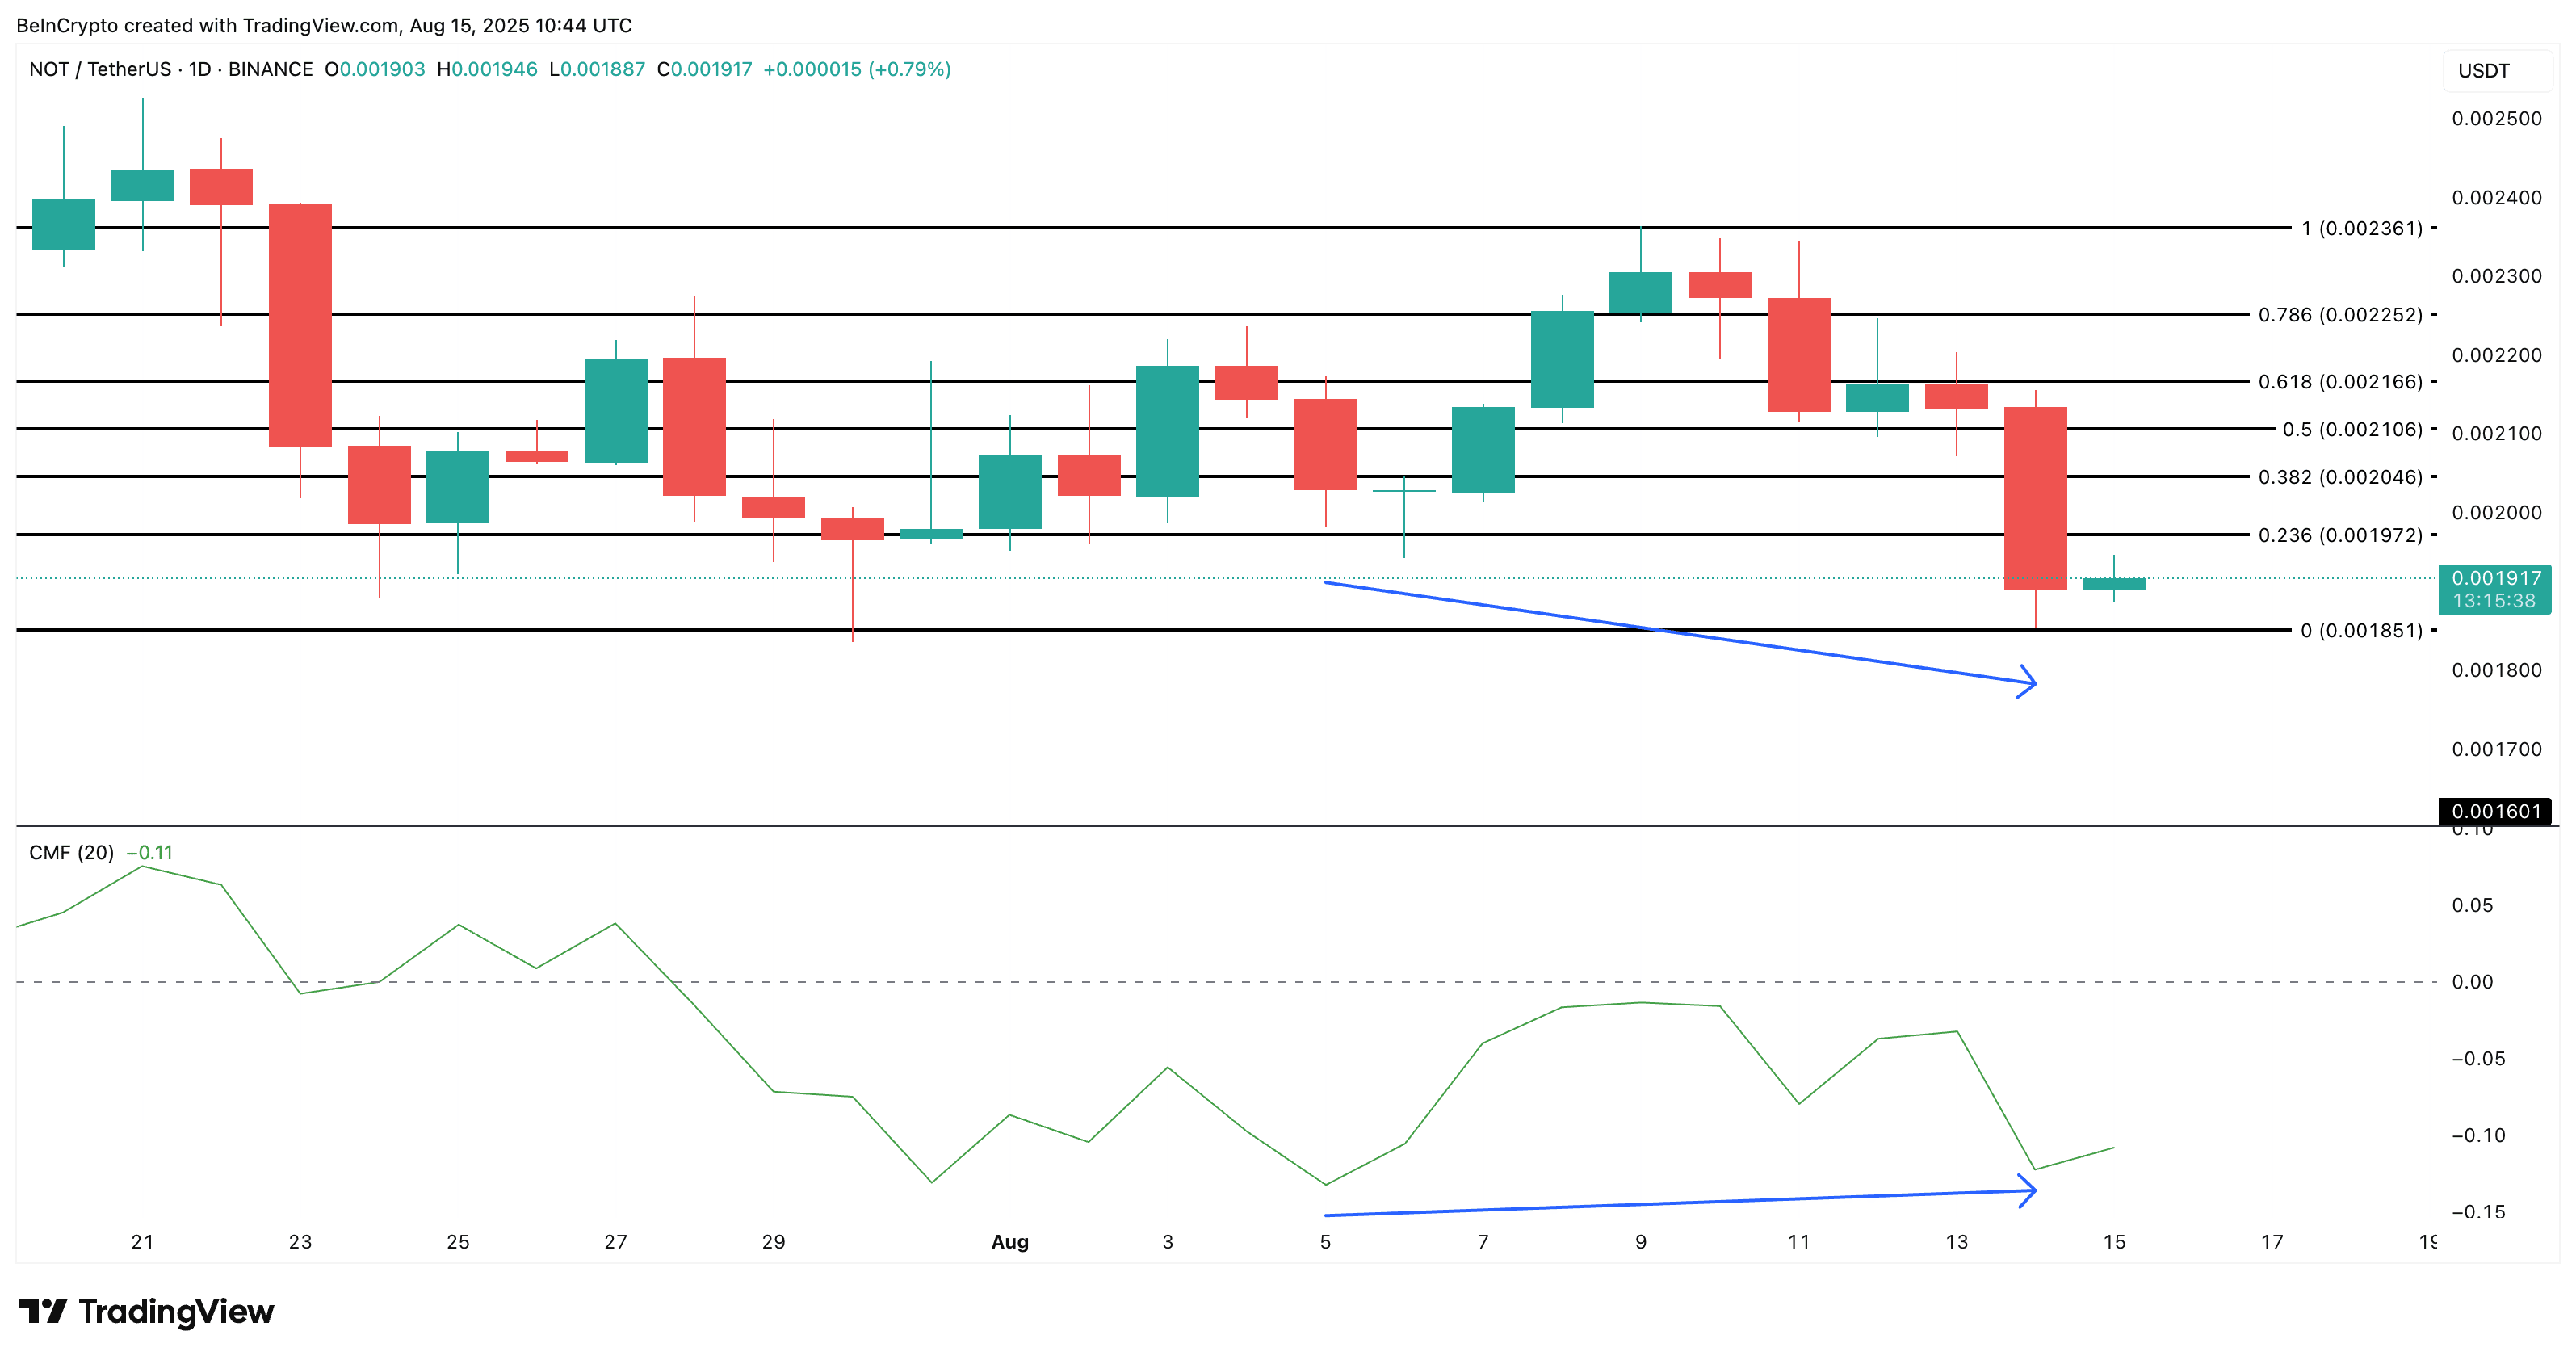
However, the CMF remains in negative territory, indicating that the market is still under net selling pressure. For this divergence to be meaningful, the CMF needs to surpass the 0 threshold, supported by a clear increase in accumulation from the top 100 addresses and a shift to net outflow from exchanges.
Chaikin Money Flow (CMF) measures buying and selling pressure based on price and trading volume. A CMF above 0 indicates buying pressure, while below 0 indicates selling pressure.
If this correction occurs, a bounce back to the $0.0019–$0.0020 range is entirely possible. However, until then, breaking below $0.0018 remains the more likely outcome, keeping the risk of hitting a new record low very high. And if that happens, Notcoin's price may test the record low of $0.0016 or even dip lower.
♡𝐥𝐢𝐤𝐞💬 ➤ @The Notcoin Official #NOTCOİN $NOT