Ethereum corrected by over 2% in the past 24 hours, briefly dropping below $4,500 before bouncing back to trade above $4,600. The drop came amid a broader pullback in the cryptocurrency market that wiped out over $240 billion in value and led to the liquidation of nearly $1 billion.
However, despite the intense selling pressure, technical and on-chain signals for Ethereum indicate that bulls still hold the upper hand.
The second highest annual flow to exchanges indicates selling pressure.
Ethereum saw a total of 2,594,168 ETH move to exchanges on August 14, marking the second highest daily flow to exchanges in 2025, only behind the spike of 3,264,688 ETH on February 3.
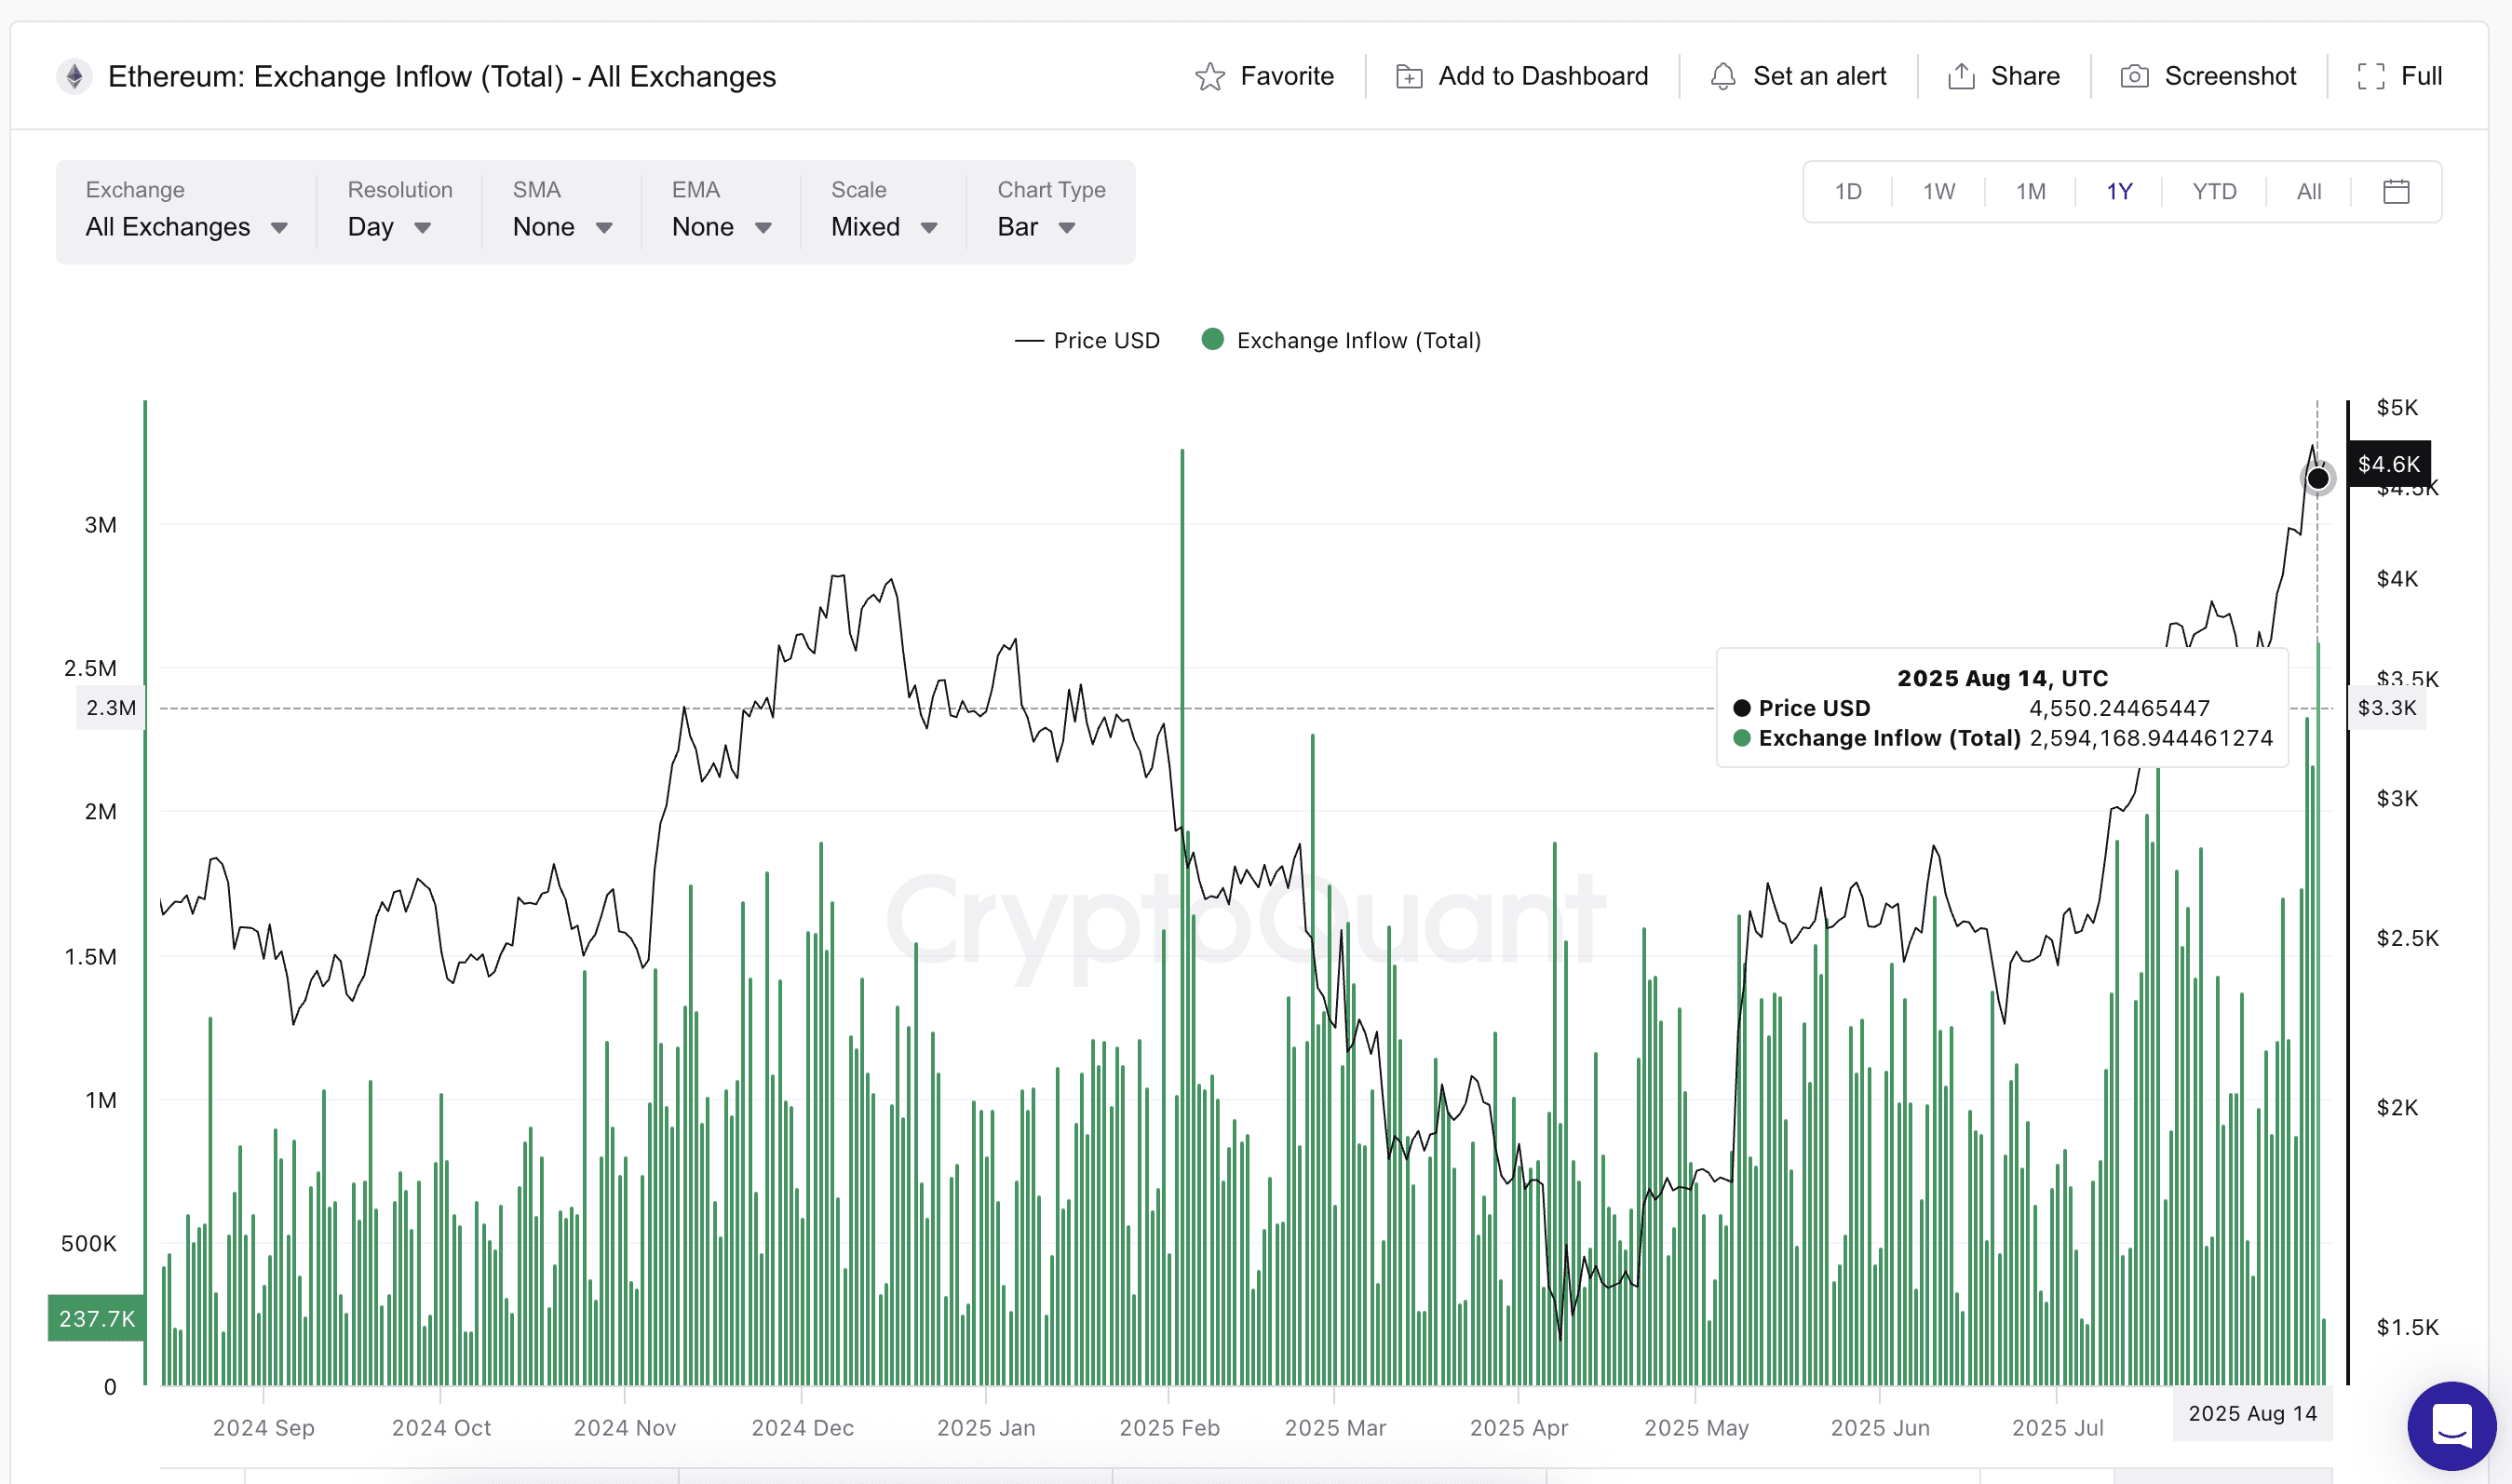
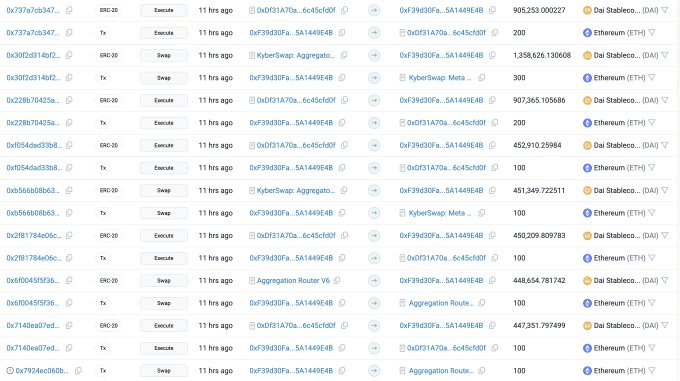
Exchange flows typically indicate potential selling pressure, and this spike was partially driven by Ethereum's institutional wallets, which were among the largest sellers recently.
Historically, high-flow local peaks lead to price corrections, as seen during the first part of 2025. At that time, Ethereum’s price was on a downtrend, and each local peak in exchange flows led to sharp declines.
Things were different as seen on July 18 (2,381,361 ETH) and August 12 (2,335,642 ETH), two local peaks driven by the current flow. Unlike the February highs driven by the downtrend, these recent flows occurred in an upward direction, which is a context where selling pressure is offset by strong buying. This absorption of buying is now the crucial factor keeping Ethereum's bullish structure intact.
Flows from large holders show buying strength that absorbs the supply.
This absorptive narrative is supported by flows from large holders - addresses that hold at least 0.1% of the total ETH supply - remaining strong. Despite a slight decline on August 13, the change over seven days stands at +98.71%, and the change over 90 days has risen to +255.27%. These wallets are known for their aggressive accumulation during dips.
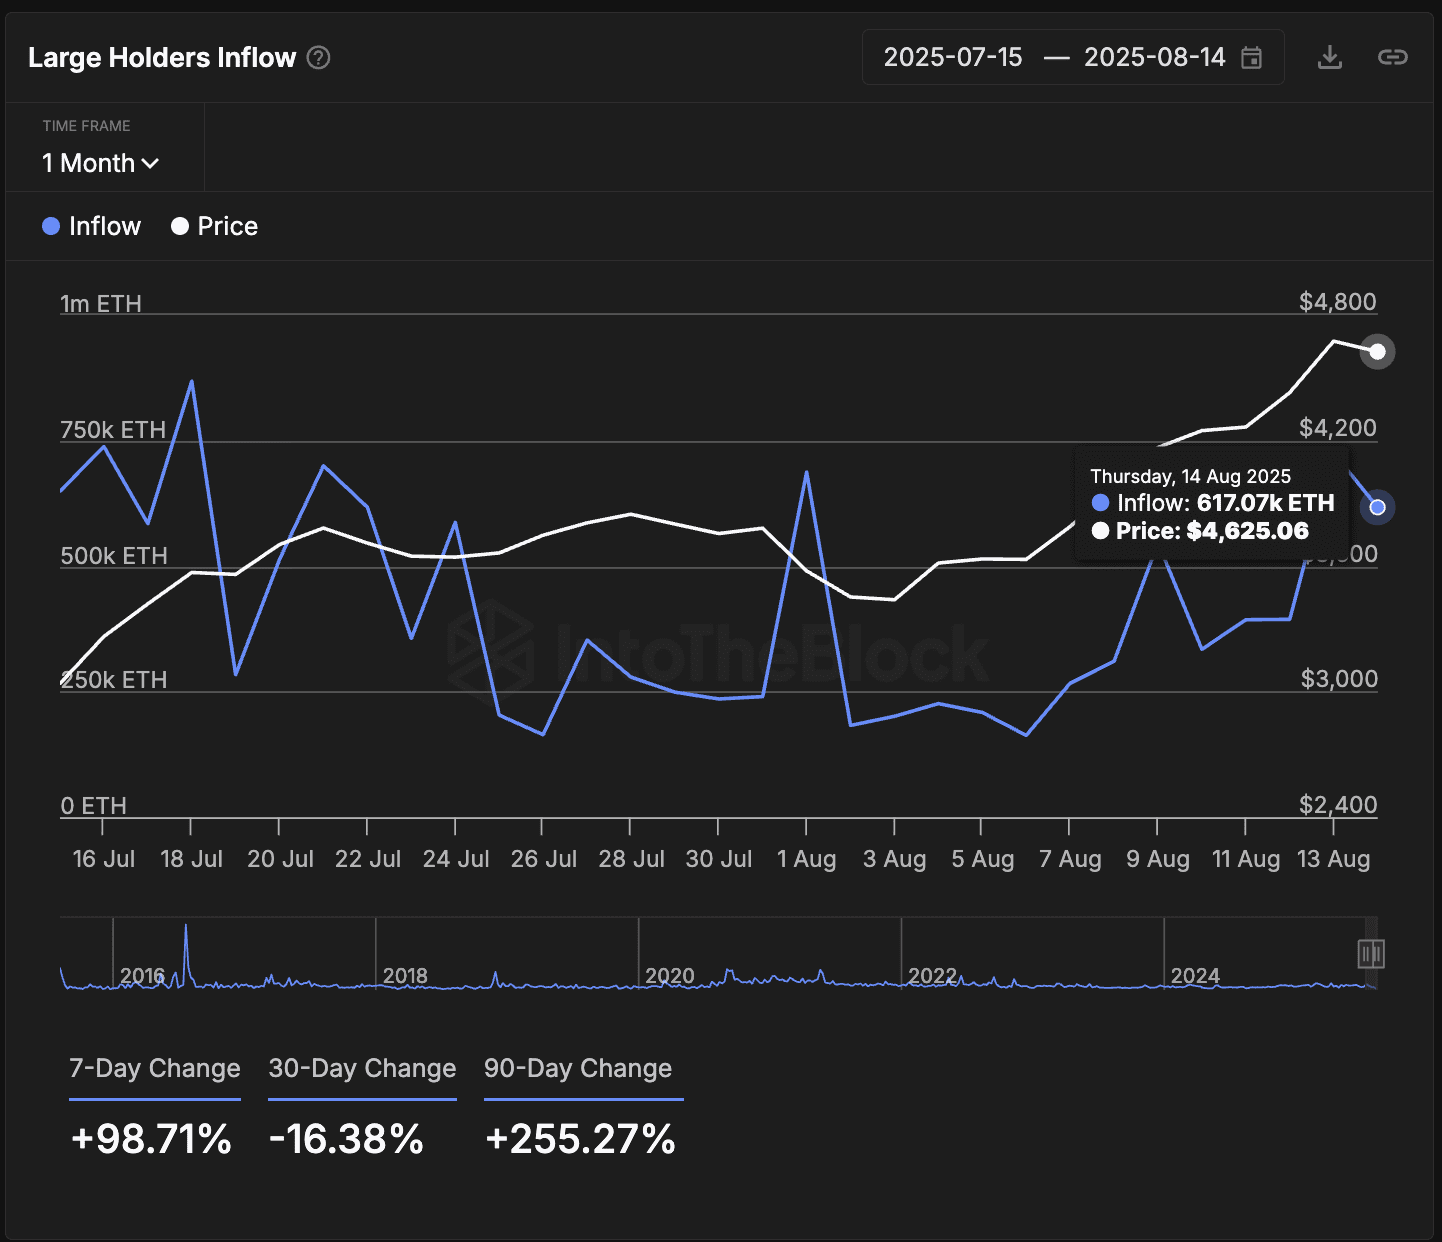
For example, between July 31 and August 1, when ETH's price dropped from $3,781 to $3,577, flows from large holders jumped from 240,190 ETH to 687,290 ETH.
Even after brief pullbacks, these flows continued to achieve higher highs on the monthly chart. The figure reached 725,000 ETH on August 13 before stabilizing at over 617,000 ETH. This is an indicator that deep-pocketed buyers are still building positions.
Exchange flows track the coins moving to exchanges and often indicate potential selling. On the other hand, large holder flows measure the quantity accumulated in wallets holding at least 0.1% of supply. It’s a metric for buying pressure from large players.
The price structure of Ethereum remains solid as bulls continue to dominate.
Technically, Ethereum's price remains bullish, with the $4,480 area acting as strong support during the recent dip. Immediate resistance at $4,785, a key Fibonacci extension level. A daily close above this could open the door towards the psychological level of $5,000, specifically $5,175.
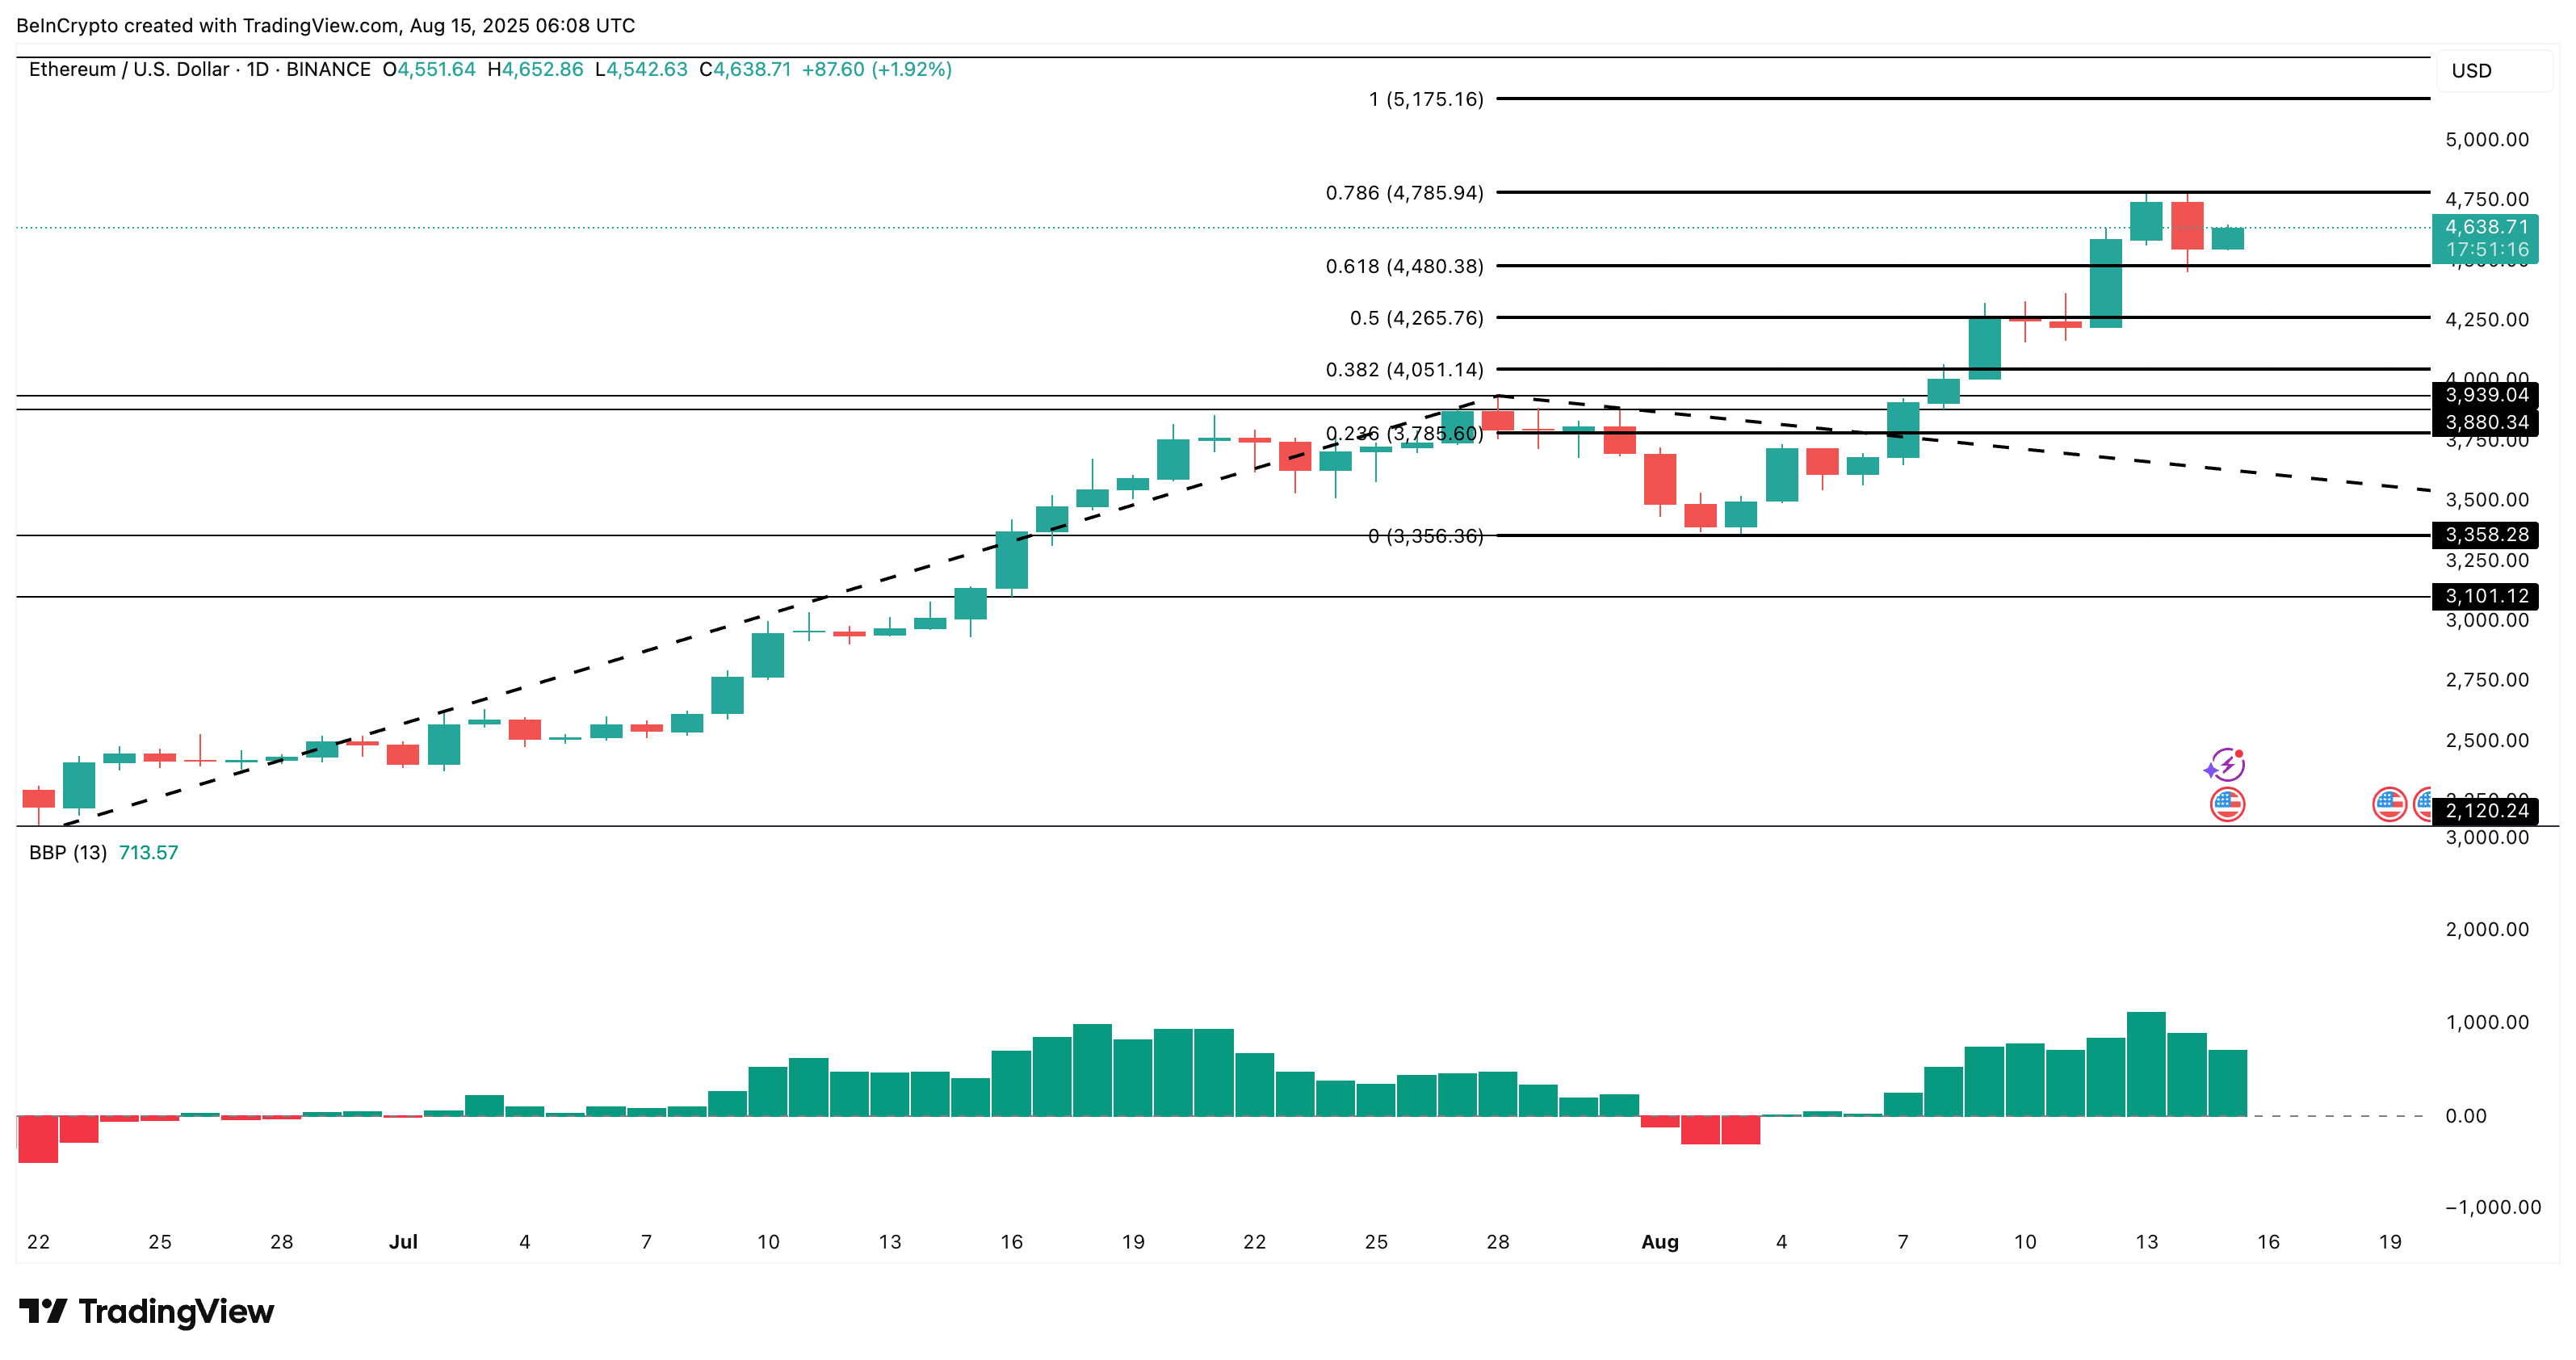
The bull and bear strength index continues to favor buyers, showing that despite the large flows to exchanges, bears have not yet gained control.
To invalidate the bullish hypothesis, a decisive break (full candle) below $4,480 is required. This should be accompanied by a sustained increase in ETH flows to exchanges and a decrease in large holder flows over 30 days; conditions that have not yet been met.