Solana has started a new upward move above the $185 area. Currently, the SOL price is consolidating above $190 and is expected to break further into the $200 area.
SOL price started to rise again, breaking above $185 and $192 against the US dollar.
The current price is above $190 and the 100-hour simple moving average.
On the hourly chart of SOL/USD, it broke below the bullish trend line support at $202 (data source: Kraken).
If the resistance area at $198 is broken, the currency pair may continue its upward trend.
Solana price is expected to rise again.
Solana price found support near $185 and started to rise significantly like Bitcoin and Ethereum. SOL climbed above $192, entering a short-term bullish area.
The price even broke through the resistance level of $200. The bulls successfully pushed the price above the $202 level. The price peaked at $210 and recently retraced to below the 23.6% Fibonacci retracement level (from the low of $174 to the high of $210).
On the SOL/USD hourly chart, the price broke below the bullish trend line support at $202. However, the bulls remain active near $188 and around the 61.8% Fibonacci retracement level of the upward move from the low of $174 to the high of $210.
Solana is currently trading above $190 and the 100-hour simple moving average. On the upside, the price faces resistance near $198. The next major resistance level is around $200.
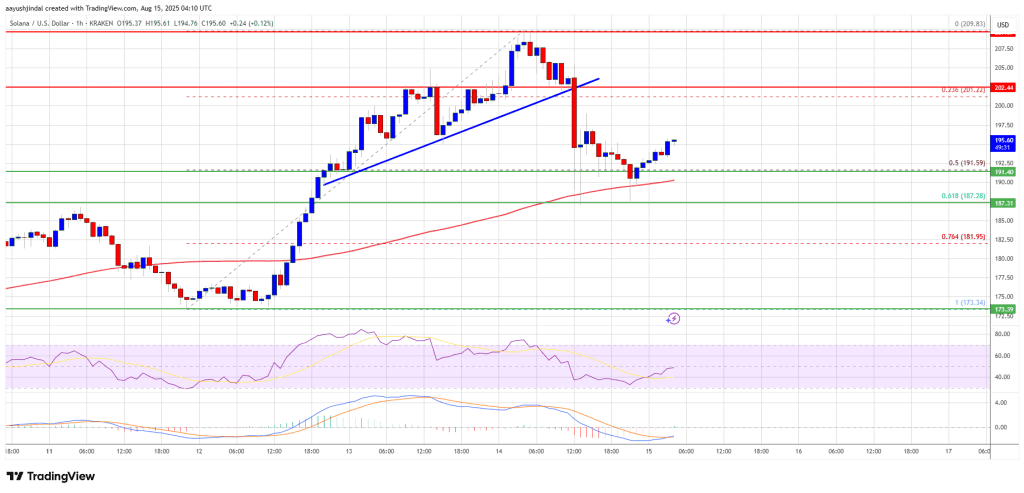 The major resistance level may be at $202. If it successfully closes above the $202 resistance level, it may initiate a new round of steady increases. The next key resistance level is at $210. If it can rise further, it may push the price toward $220.
 Is SOL sliding again?
If SOL fails to break the resistance level at $200, it may decline again. On the downside, the initial support level is near $192. The first major support level is around $188.
Breaking below the level of $188 could push the price toward the support area at $180. If the closing price falls below the support level of $180, the price may drop to the support level of $175 in the short term.
Technical indicators
Hourly MACD - The MACD for SOL/USD is losing momentum in the bullish area.
Hourly RSI (Relative Strength Index) - The RSI for SOL/USD is below the 50 level.
Major support levels - $192 and $188.
Major resistance levels - $200 and $210.
