
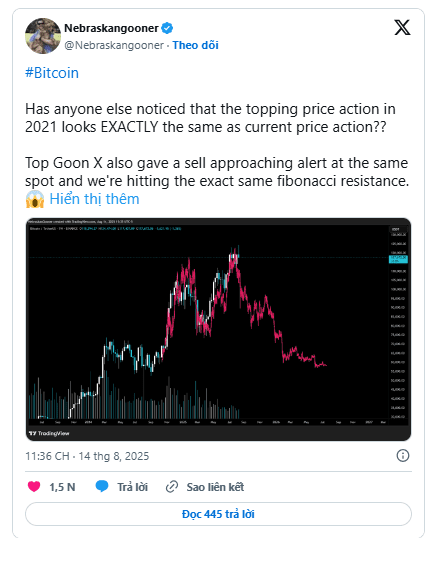
According to a cryptocurrency trader, the Bitcoin price chart is starting to mimic a similar pattern as when it reached the previous cycle's all-time high of $69,000 in November 2021.
However, other traders argue that charts no longer fully reflect the story as demand for Bitcoin from cryptocurrency fund managers continues to rise.
Bitcoin Chart Looks Similar to 2021, Trader Says
Technical analysts often compare Bitcoin price charts to similar patterns in previous cycles to see when the price might peak, when to sell, and when money might start moving into other assets.
"Has anyone noticed that the peak price movement in 2021 looks exactly like the current price movement?", cryptocurrency trader Nebraskangooner said in a post on X on Thursday, while pointing to a chart showing a double top pattern often seen by traders as a bearish trend and signaling a potential trend reversal.
Cryptocurrency analyst Benjamin Cowen agrees and states that the Bitcoin chart has the same pattern every year after halving.
"Rise in July-August. Fall in September. Rise at the market cycle peak in Q4. Bear market," he said.
Traders Using Charts to Predict Prices Are "Fooling Themselves"
However, cryptocurrency trader Kale Abe said Nebraskangooner's observation is "another case where charts and fractals don't matter."
"The only thing that matters is treasury companies and whether they run out of money or not," Kale Abe said. Data from BitcoinTreasuries.Net shows that publicly listed Bitcoin treasury companies have accumulated $150.98 billion in Bitcoin.
Abe also suspects Bitcoin will "enter a bear market" as Ethereum approaches its all-time high. "No way," he said. Ether has risen 19% in the past week, trading at $4,612, about 5.75% lower than its all-time high of $4,878 in 2021.
This incident comes just weeks after veteran trader Peter Brandt told Cointelegraph Magazine: "Anyone looking at a chart and trying to tell you how everything is going to play out is really just fooling themselves."
Brandt said the only real use of price charts is to see where the price has been and where the current price is.