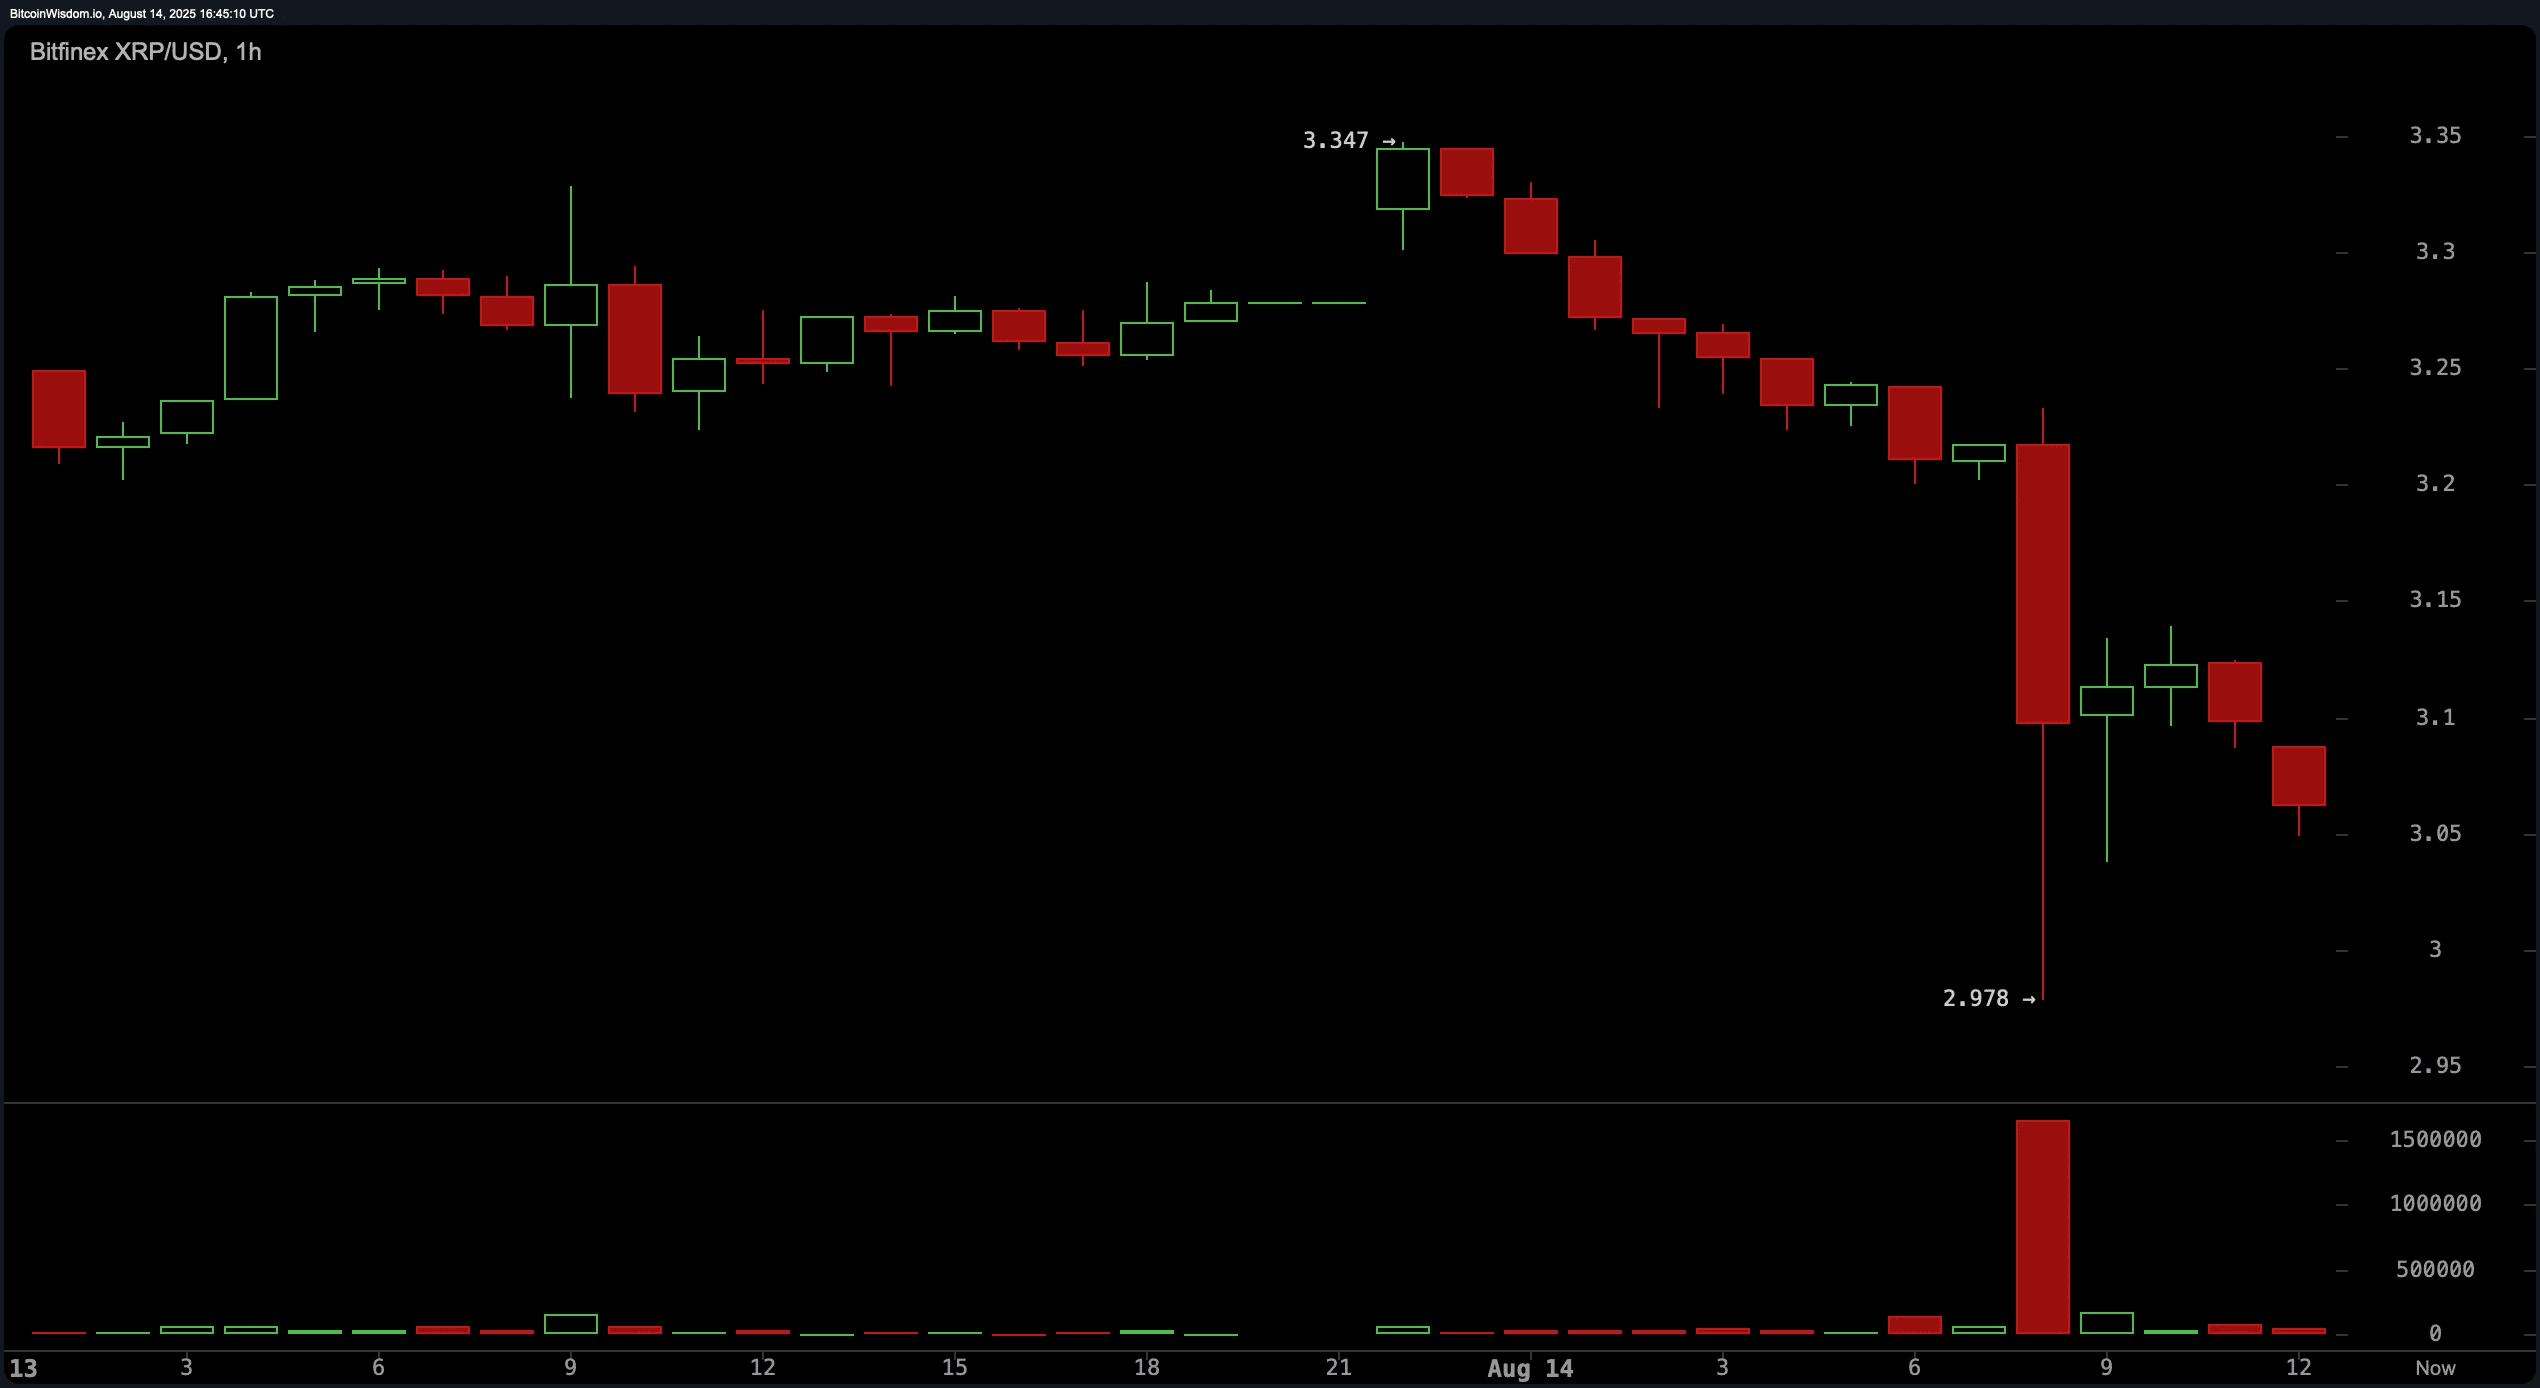
$XRP On the hourly chart, XRP shows signs of short-term consolidation after a sharp drop from $3.34 to $2.97.
Although there was a temporary recovery to the $3.15 area, the price is currently fluctuating in the $3.07–$3.10 range, indicating weak buyer activity.
A significant surge in volume during a bearish candle signals substantial selling pressure, likely from institutional participants.
Attempts to rise encounter resistance at $3.15, making it a short-term resistance level. The coin appears to be forming a base around $3.05, and bullish momentum will resume if the $3.12 level is reclaimed.
============
The 4-hour chart supports a broader bearish sentiment, with XRP sharply dropping from around $3.30 to $2.98 on one decisive candle.
Despite a minor recovery attempt, the price remains below $3.10, confirming a pattern of lower highs and lows.
High-volume candles indicate seller dominance, while weak recoveries show little buyer activity.
Traders may find speculative entry points in the $2.95–$3.00 range with tight stops below $2.90. Resistance is firmly established between $3.15 and $3.30, where failed rallies are likely to face profit-taking.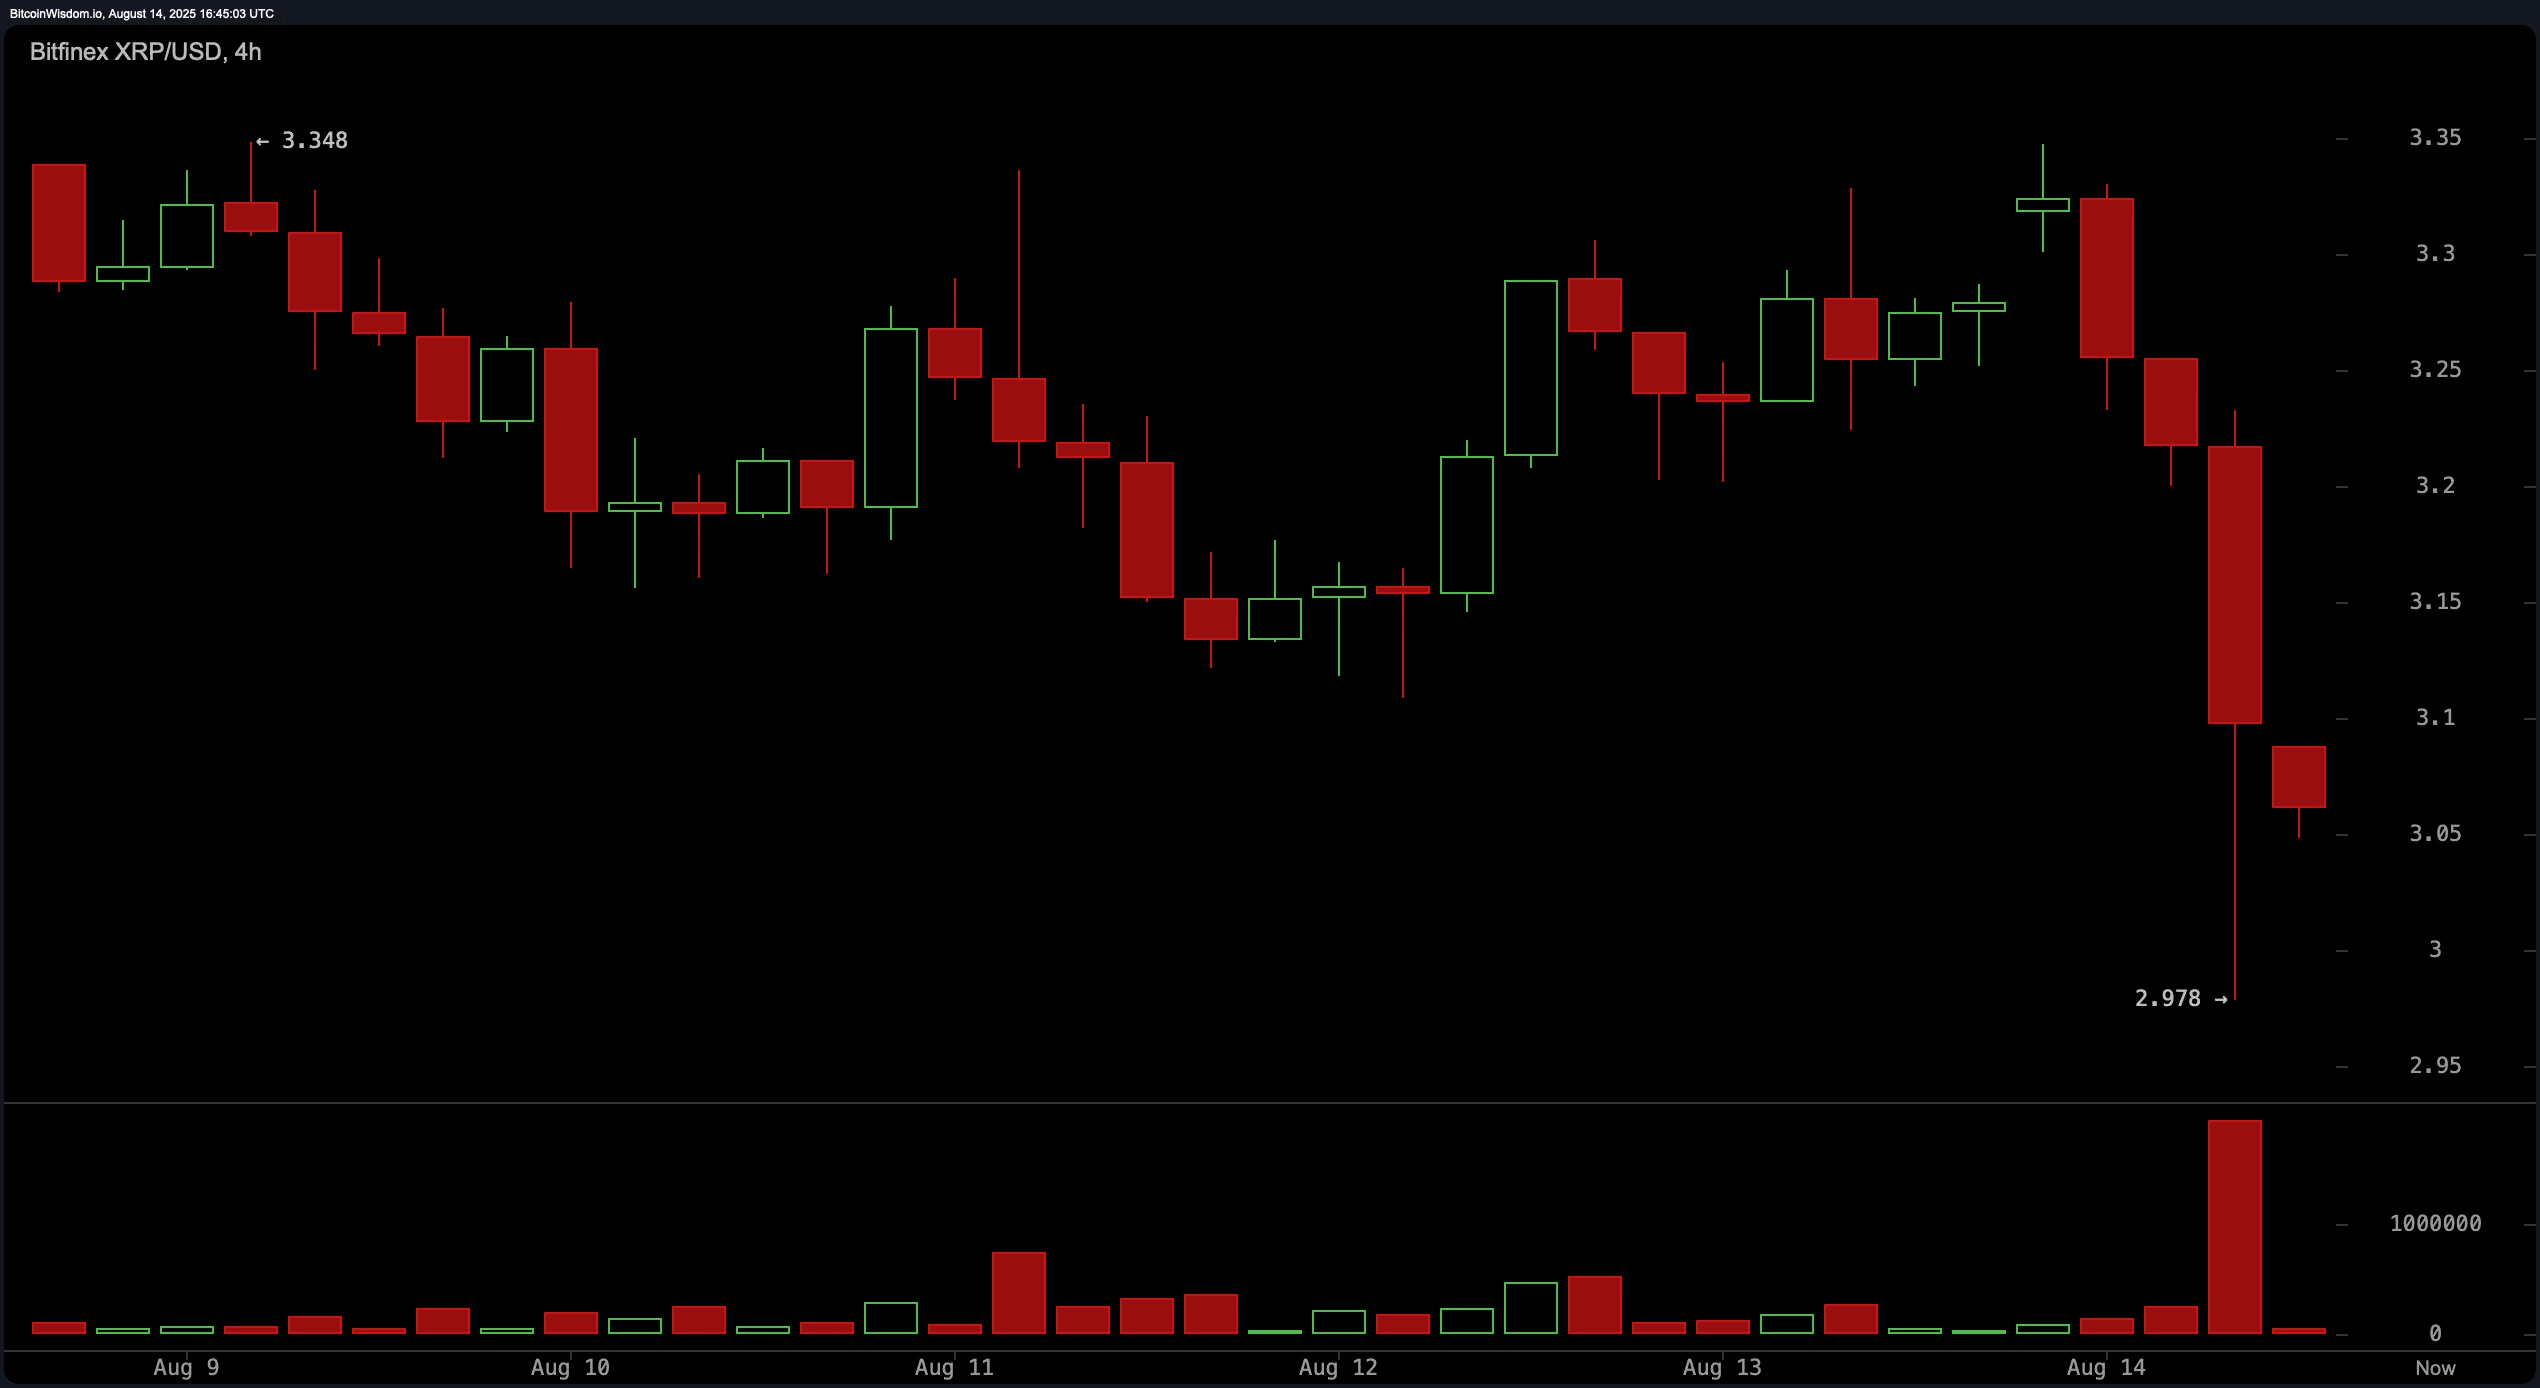
==========
Daily chart analysis further confirms the bearish structure. After peaking around $3.66, XRP underwent several days of correction, breaking support at $3.10 on high volume.
The structure now shows a double top around $3.65 — a classic bearish reversal pattern — heightening caution.
The last red candle also broke previous lows, reinforcing the bearish scenario.
Short-term resistance is located at $3.25–$3.35, while strong support is in the $2.80–$2.90 range, where bulls may consider re-entering if the price stabilizes.
============
Bullish verdict:
The current consolidation of XRP above key support levels, combined with long-term moving averages signaling continued growth, indicates that the broader upward trend remains intact.
If bulls can reclaim the $3.12–$3.25 range with high volume, a new rally to $3.34 and beyond is expected, supported by institutional buying on dips.
========
Bearish verdict:
The dominance of bearish price structures on intraday and daily charts, coupled with weak momentum indicators and persistent resistance at $3.15 to $3.35, indicates further downside risk.
If the price does not regain the $3.25 level, the path of least resistance remains downward, with a possible retest of the support zone at $2.90 to $2.95 in the near term.
