In this tumultuous world of cryptocurrency, news dances with K-lines, and trends shift like the wind and clouds. BTC, forever the brightest star, pulls at the heartstrings of countless investors. Today, let's have a good chat about the market story behind BTC's 1-hour K-line chart.
Let's take a look at this 1-hour K-line chart
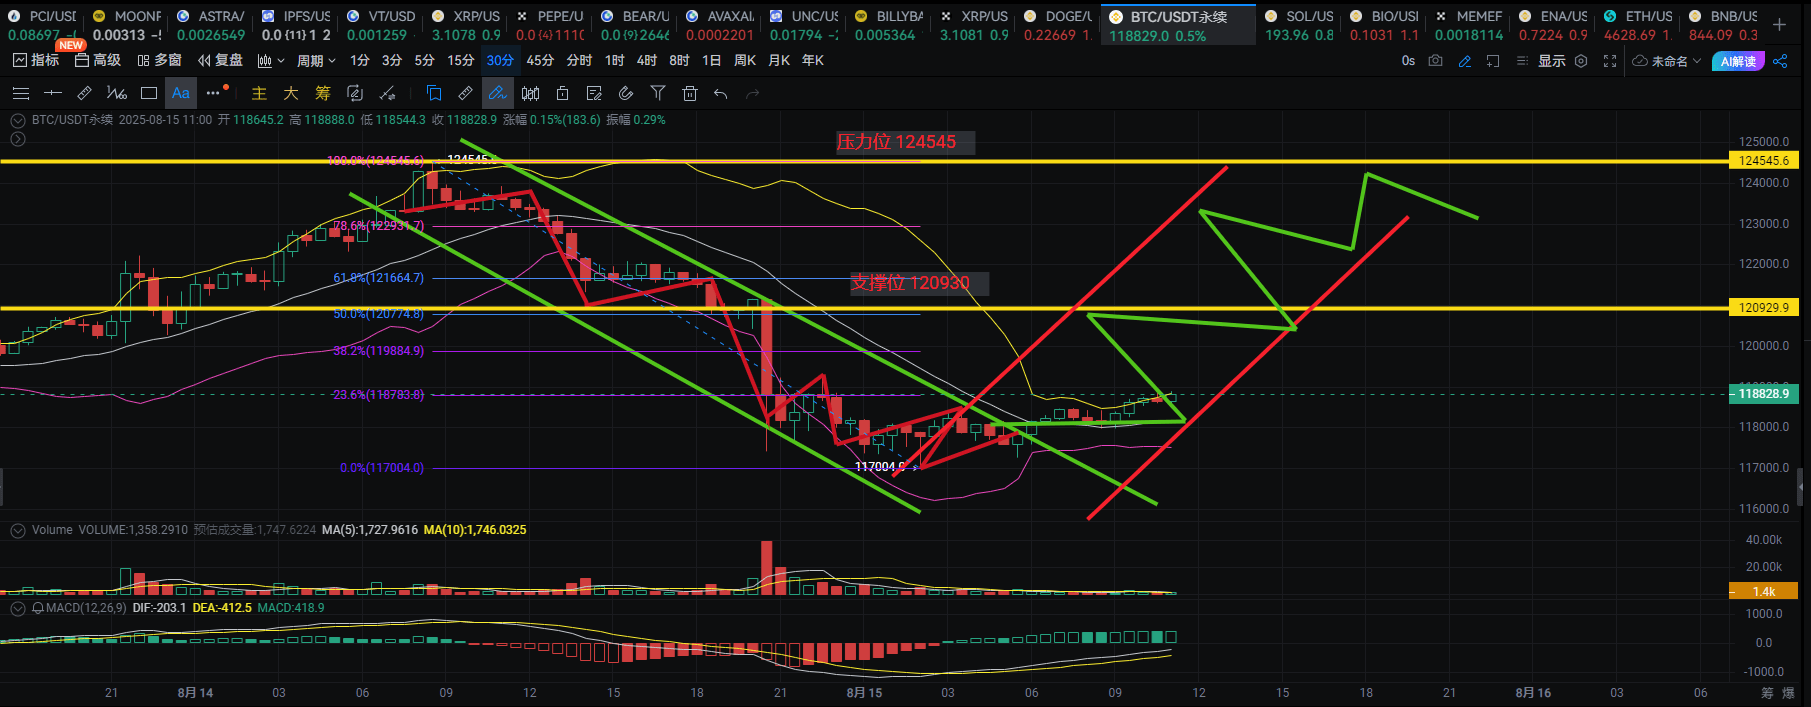
BTC is hovering around $118,954, like a traveler hesitating at a crossroads about which way to go. From the trend lines on the chart, BTC has gone through a 'Waterloo', with prices plunging down until it barely managed to stop around $117,004, which has become its temporary 'safe haven', or what we often refer to as the support level. Above, $124,545 looms like an insurmountable mountain; several attempts to breach it have been in vain, representing a strong resistance level.
Speaking of news
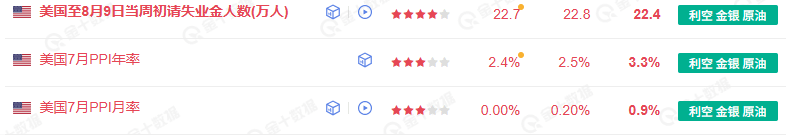
Today, there are quite a few new updates in the circle. Reports say that some traditional financial institutions are starting to pay more attention to the cryptocurrency field, even planning to launch financial products related to BTC. This undoubtedly injects a strong dose of optimism into the market, as the entry of traditional financial giants means more capital and broader recognition. However, there are also some bearish news, such as certain countries tightening regulations on cryptocurrency trading, which is like a dark cloud, bringing a bit of uncertainty to the market.
Personally, I feel that
Currently, BTC is at a critical juncture. From a technical perspective, it is oscillating above the support level, indicating that there is some buying support below. However, the resistance level above is very real, like a tightening curse. Previously, BTC was also hovering near a similar support level, during which the market was filled with various rumors, but ultimately, it chose to break upwards, leading to a nice uptrend. Whether this time can replicate the previous trend remains uncertain.
Looking at the trading volume, it is generally not very active; everyone seems to be waiting for a clear signal. In the MACD indicator, the DIF line and DEA line are entangled at a low level, and the MACD histogram values are also small, indicating that both bulls and bears are building momentum, and neither dares to act easily.
For us retail investors, it feels like walking on a tightrope; we must be very cautious. If you hold BTC, you might want to hang on and see if the price can break above the resistance level. If it breaks through, it could lead to a major market movement; if it falls below the support level, you should quickly cut losses. If you haven't entered the market yet, don't rush; it's also fine to wait until the trend becomes clearer before taking action.
The crypto world is like this, full of opportunities and challenges. Every fluctuation of BTC could make some people overnight millionaires, while others may lose everything. But it is precisely this uncertainty that makes this market so captivating. Want to know how BTC will move next? Will it break through the resistance level and soar, or will it fall below the support level and slump? Follow me, and I will provide you with the most cutting-edge analysis and interpretations, ensuring you stay updated on the latest market trends in this crypto realm!
Don't wait until your contract gets liquidated to remember me! Follow@船长大哥 , and next time I'll help you escape the peak 3 seconds early! The captain's scythe is faster than the market makers! Follow me, and I will teach you how to counter the market!