According to information, Bitcoin price is correcting, cutting back on the gains since $124,000. Currently, BTC is oscillating below $120,000 and may see a rebound.
Bitcoin has started a downward correction from $124,000.
The trading price has fallen below $122,000 and the 100-hour simple moving average.
On the hourly chart of BTC/USD, the key bullish trend line has been broken, with current support at $120,000 (data source: Kraken).
If it breaks through the resistance area of $120,000, this currency pair may initiate an upward trend again.
Bitcoin price has experienced a significant decline.
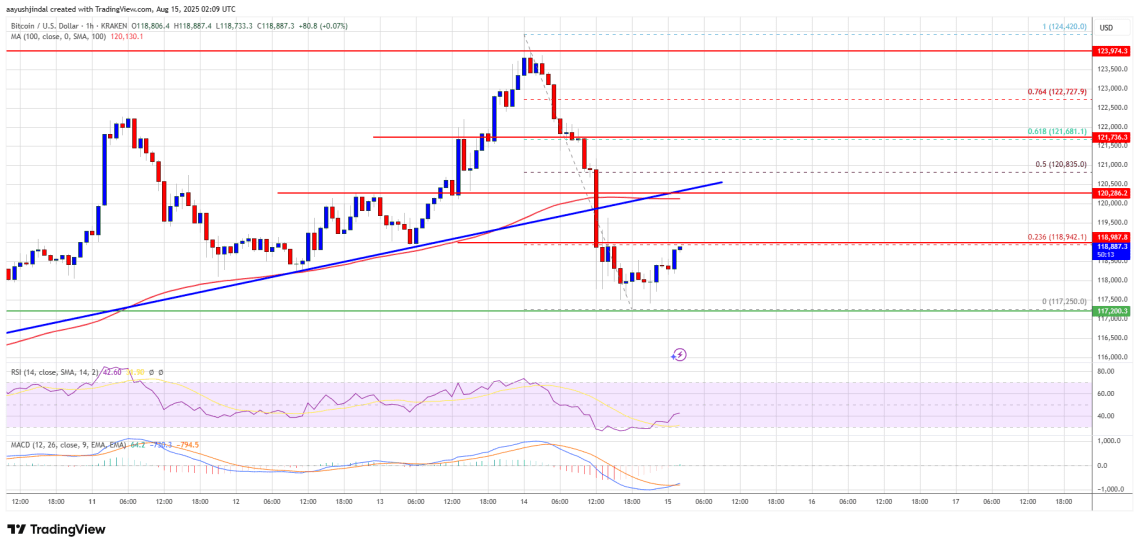
Bitcoin previously set a historical high around $124,000 before the bears appeared, then began to correct and broke below the support level of $122,000.
The price has broken below the $121,200 support level and has fallen below the 100-hour simple moving average. Additionally, on the hourly chart of BTC/USD, the price broke below the key bullish trend line support at $120,000, testing the $117,250 area.
Currently, Bitcoin is stabilizing its decline and has partially rebounded, testing the 23.6% Fibonacci retracement level from the swing high of $124,420 to the swing low of $117,250. The current trading price of Bitcoin is still below $120,000 and below the 100-hour simple moving average.
Is BTC declining again?
If Bitcoin fails to break through the resistance at $120,000, a new downward trend may begin. The current support level is around $118,000, with the first major support at $117,250.
The next support level is near $116,500, and if the price drops further, it may reach the support at $115,500 in the short term. The main support level is at $113,500, and if this level is broken, BTC may continue to decline.
Technical indicators:
Main support level - $117,250, followed by $116,500.
Major resistance levels - $120,000 and $120,500.
Like and follow for more; there's still time to join the ride, let's feast together!!!
