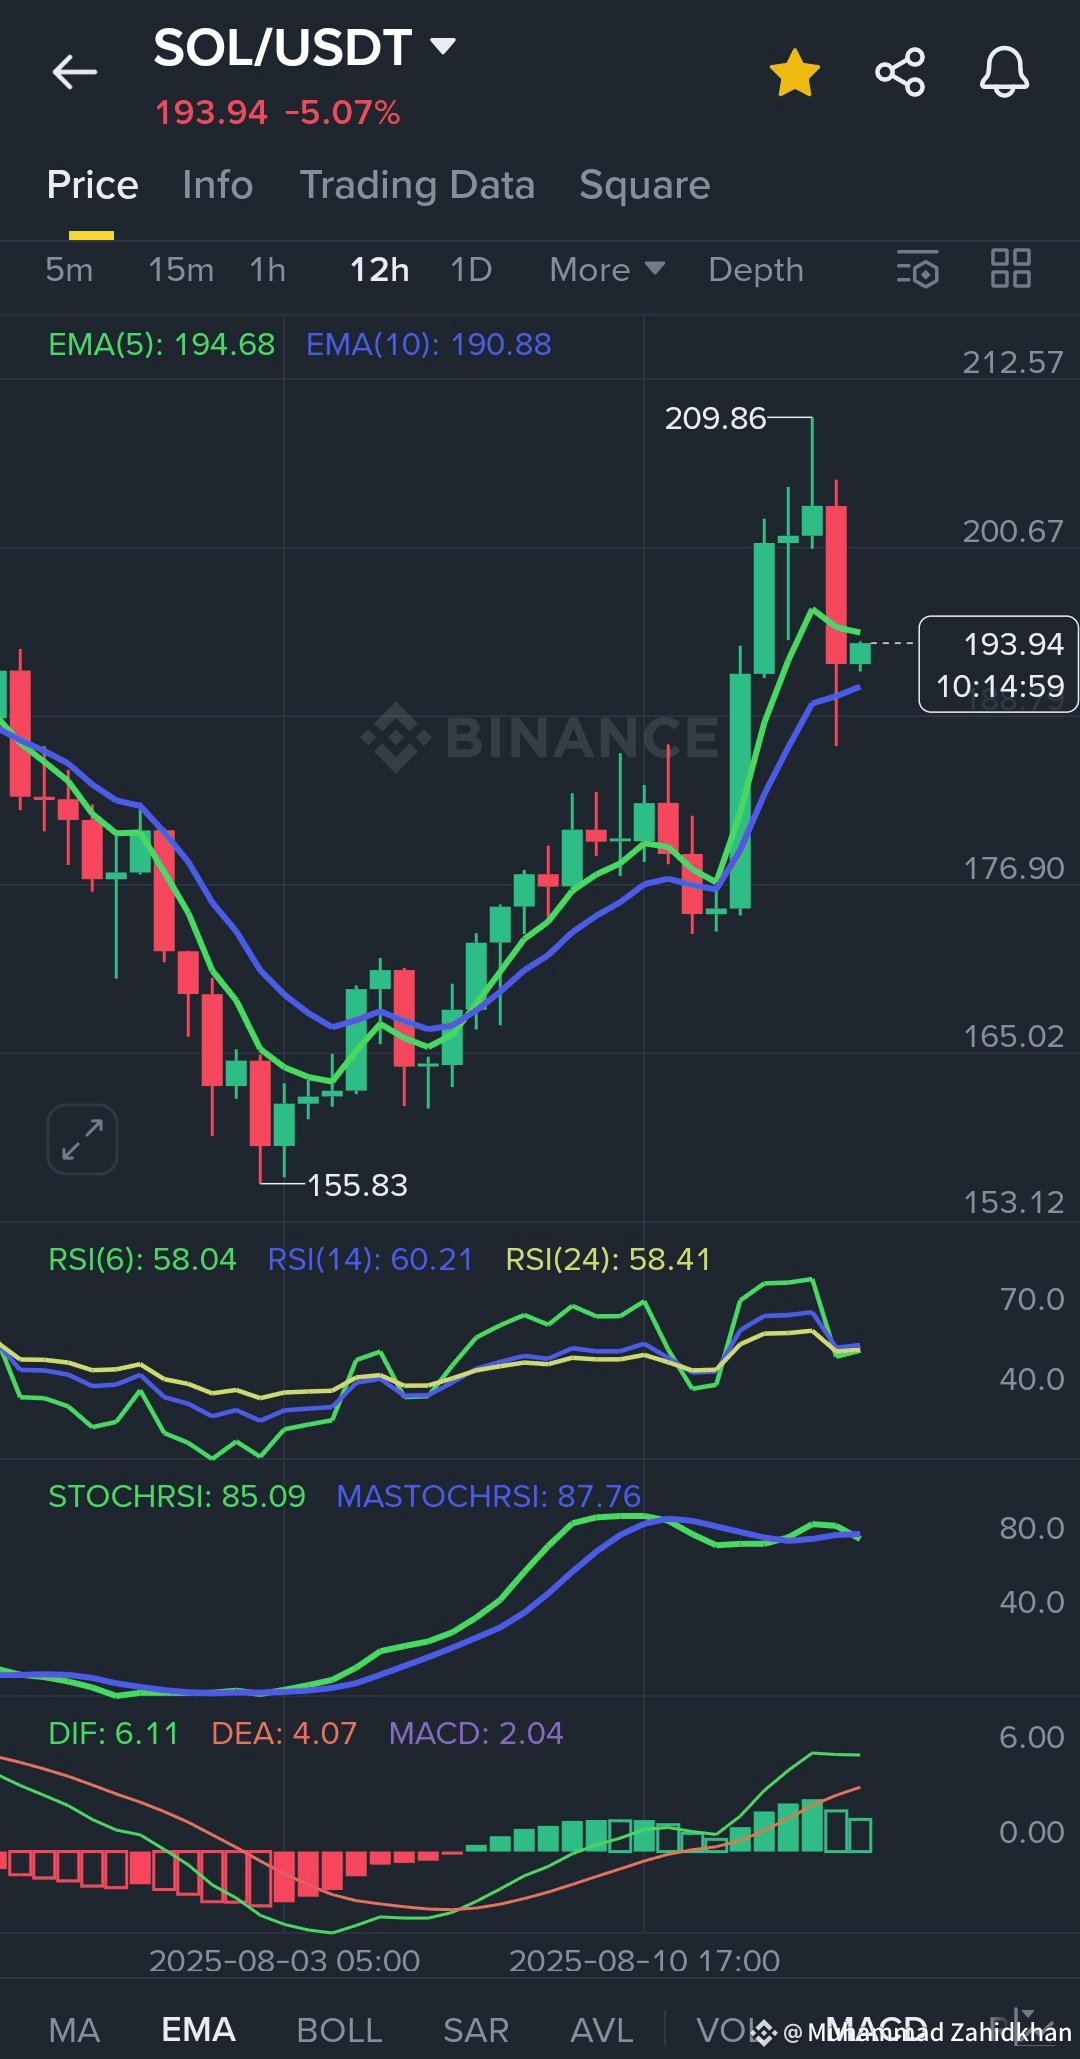
By analyzing through technical indicators SOL/USDT in 12 hr chart:
- Price (193.94) is just below EMA(5) (194.68) but above EMA(10) (190.88), showing short-term caution but overall bullish bias.
- RSI(14) at 60.21 indicates moderate bullish momentum, not overbought.
- StochRSI high at 85.09 signals overbought conditions, hinting at potential short-term pullback or consolidation.
- MACD positive (DIF 6.11 > DEA 4.07) confirms ongoing upward momentum.
Trade plan:
- Entry: Wait for a dip near $190–$191 (EMA10 area) for a safer buy.
- Take Profit (TP): $210–$212 zone (recent resistance).
- Stop Loss (SL): Below $188 to limit downside risk.
In short, SOL is bullish but expect a short pause or pullback before the next push up.
Lets trade by believing on the above mentioned trade plan, i hope you will get good profit.
Like, follow and share this article🙏🙏🙏