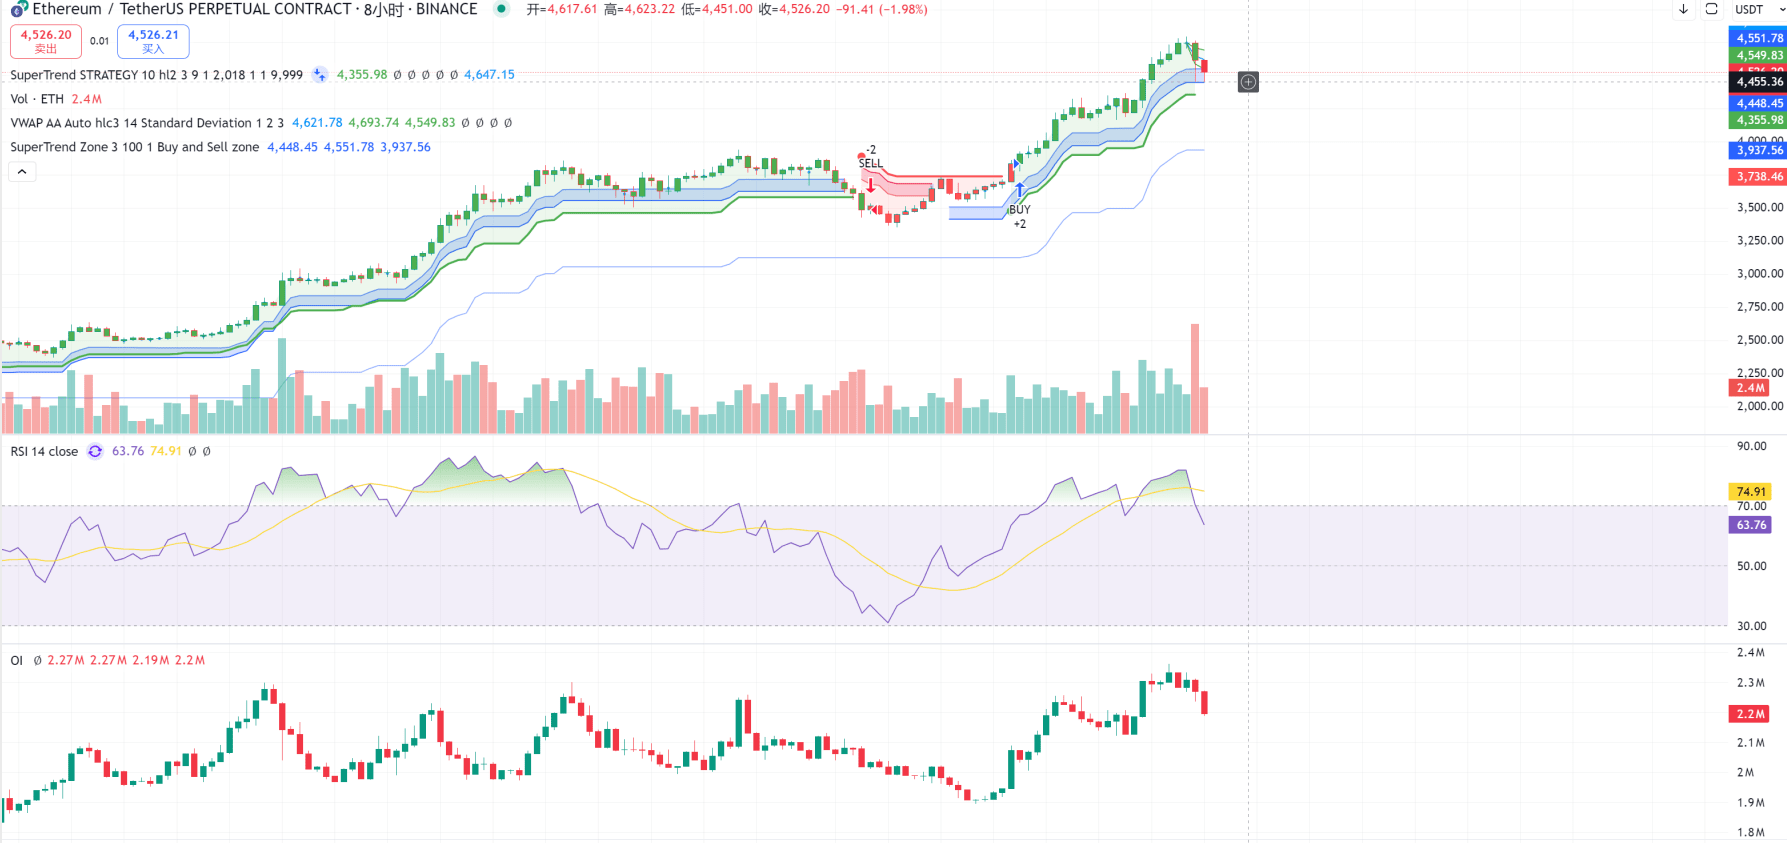
The above chart shows the 8-hour level for ETH. There were two spikes around 4450. Currently, there is still a significant amount of active buying at this position. The light blue line represents the trend line of this upward trend, starting from around the 3600 price level. This means that the positions where the two spikes occurred are just below the breaking point of the upward trend line. The upward trend is precarious. Therefore, saying that we have already entered a pullback cycle is still a bit premature. However, the two dips to this position indicate that market makers are currently pushing prices downward. If the price breaks below this level, it can likely be confirmed that we have entered a pullback. The extent of the pullback is difficult to predict and will depend on the determination of bulls to buy the dip. Just like this surge, it also considers the position where bears give up the struggle. If considering to make a short-term long bet for around 50 points, it is advisable to do so near 4450. However, stop losses should definitely not be placed in the 4440-4420 range, as this is the stop loss area for the vast majority of those betting on a rebound, making it very easy to get swept out. If the 8-hour level breaks below 4450 and does not recover, the pullback trend will basically begin.
It is also important to note that any large pullback cycle is basically caused by the first significant drop to a sideways movement entering a low liquidity area, then pulling up to a secondary high point to capture liquidity before continuing to decline. Therefore, shorting can easily lead to losses during the process of pulling to the secondary high point, which is currently predicted to be slightly above 4600.

