How to Read BTC Candles Like a Pro — A Live Example
(BTC/USDT — Price: $118,111)
1. The Basics of Candlesticks
Each candle shows the battle between buyers and sellers in a set time frame:
Body → Where price opened and closed.
Wicks (Shadows) → The highest and lowest points reached.
Color → Green = bullish close, red = bearish close.
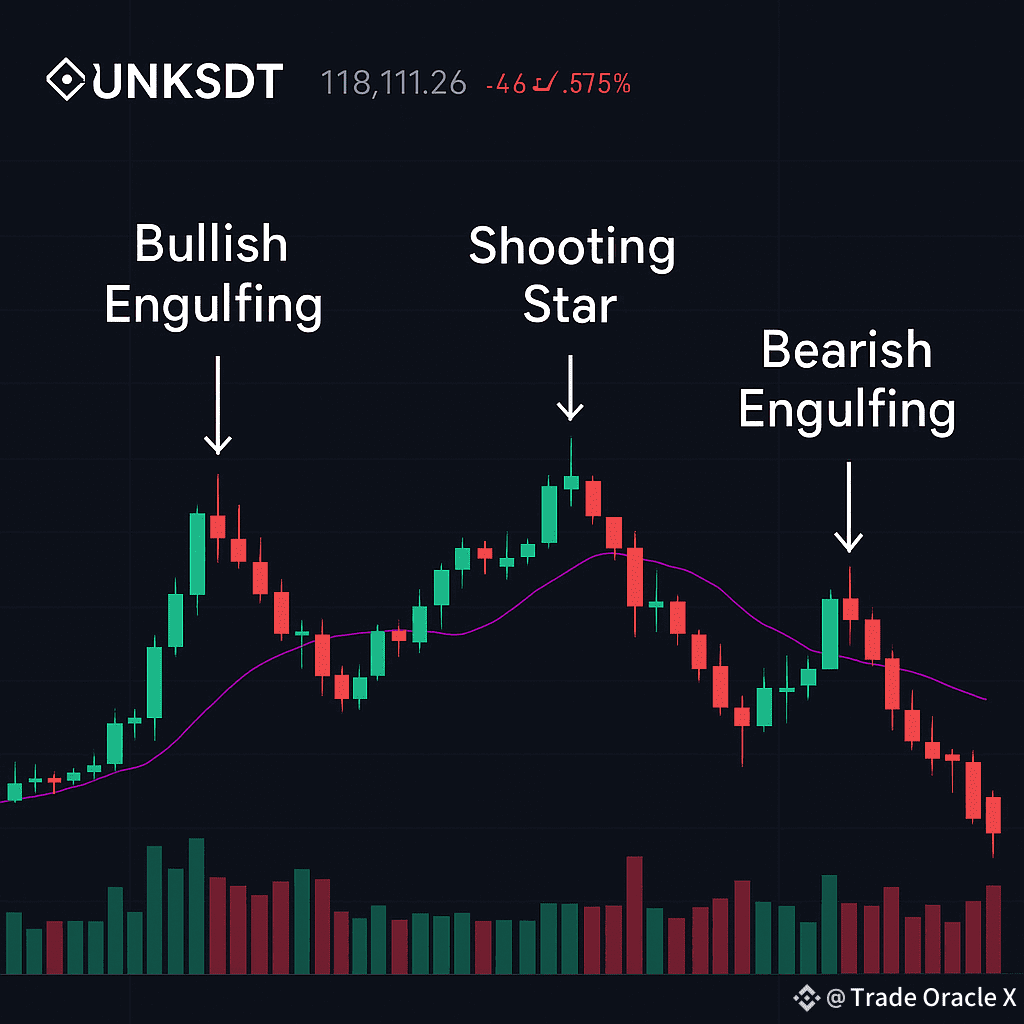
2. What This BTC Chart Shows
A. Recent Price Peak — Shooting Star Candle
Around $124,474, there’s a tall upper wick with a small body.
Buyers pushed price up but sellers regained control.
This often signals short-term exhaustion before a pullback.
B. Heavy Red Candle — Panic or Profit-Taking
Large red body breaking below the 7-day MA.
Strong selling momentum, likely triggered by stop-losses and profit-taking.
Big bodies after a peak can start correction waves.
C. Long Lower Wick — Buyer Defense
On the drop near $111,920, the candle shows a long lower wick.
Sellers pushed down, but buyers stepped in fast.
These wicks often mark strong support zones.
3. Volume — The Truth Detector
Spikes in volume during large red candles = high-conviction selling.
Volume rebound on green candles = buyers defending a key level.
4. Trading Takeaways
After a big rally with a shooting star or doji → tighten stops or take partial profits.
When a sudden heavy red candle appears with high volume → avoid chasing entries.
When a long lower wick forms at support → consider scaling into a position.
5. Quick Tip for Beginners
One red candle in an uptrend does not always mean reversal — always confirm with volume and support/resistance before acting.