Here’s a deep 12-hour analysis for BNB/USDT:
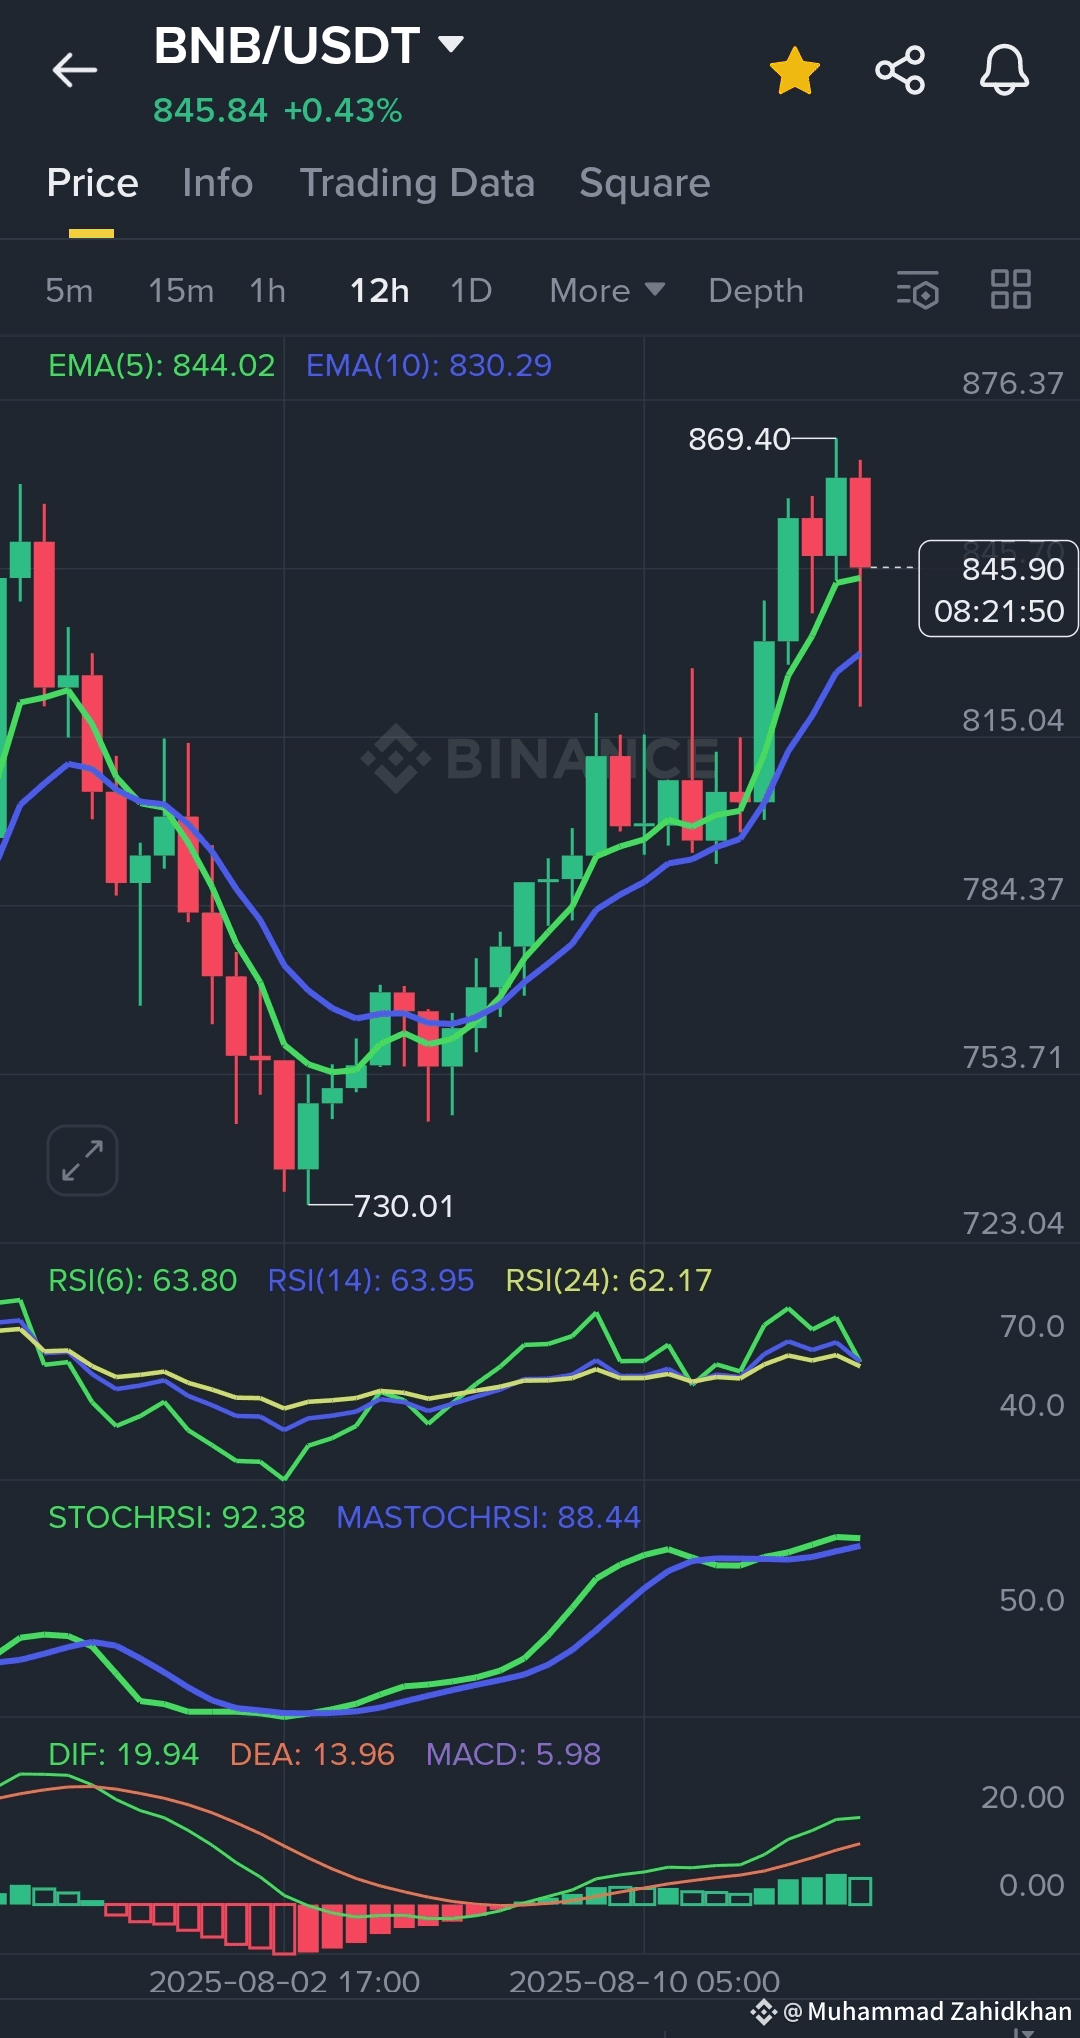
- Price recently dropped from a high of 869.40 to around 845.90, showing a short-term pullback after a strong uptrend.
- EMA(5) at 844.02 above EMA(10) at 830.29 confirms bullish momentum is still intact despite the dip.
- RSI(14) around 64 indicates moderate strength, not yet overbought, so room to move up.
- StochRSI very high near 92 suggests overbought conditions, warning of possible short-term consolidation or minor drop.
- MACD positive (DIF 19.94 > DEA 13.96) confirms bullish trend but histograms shrinking, signaling momentum may be slowing.
Trade plan:
- Entry: Wait for price to hold above 835–840 support zone before adding longs.
- Take Profit (TP): First target near 869–872, if broken next aim is 890–900.
- Stop Loss (SL): Set below 830 to manage downside risk.
Summary: BNB looks bullish on 12H but cautious—expect minor pullbacks or sideways moves before pushing higher. Support around 835–840 is key.