Traders who operate in very short time frames sometimes focus on just one candle. Familiarizing yourself with these "one candle signals" can be a useful exercise as a beginner. In the image below, you will find four common one candle signals:

A long upper shadow could be an indicator of a bearish trend, meaning that investors are looking to sell and take profits. The longer the upper shadow, the stronger the indicator will be.
A long lower shadow could be a bullish signal, indicating that investors are looking to buy, which pushes prices up. The longer the lower shadow, the more reliable the signal will be.
A Doji candle has no body, because the opening and closing prices are the same. These are generally interpreted as indicating indecision in the market, and are a possible indicator of an upcoming price reversal. (Why “doji”? Candlestick charts were first used by Japanese rice traders in the 18th century. “Doji” means mistake — presumably because it would be uncommon for prices to open and close at the exact same spot.)
Inverted hammers have a distinctly long lower wick. A red inverted hammer is also known as a hammer. When you see a hammer, it often means that the asset is receiving serious buying action — and that the price could be about to rise. Green inverted hammers, on the other hand, have a ominous nickname: hanging men. They are often a signal that sellers are ready to cash in — reversing the bullish cycle.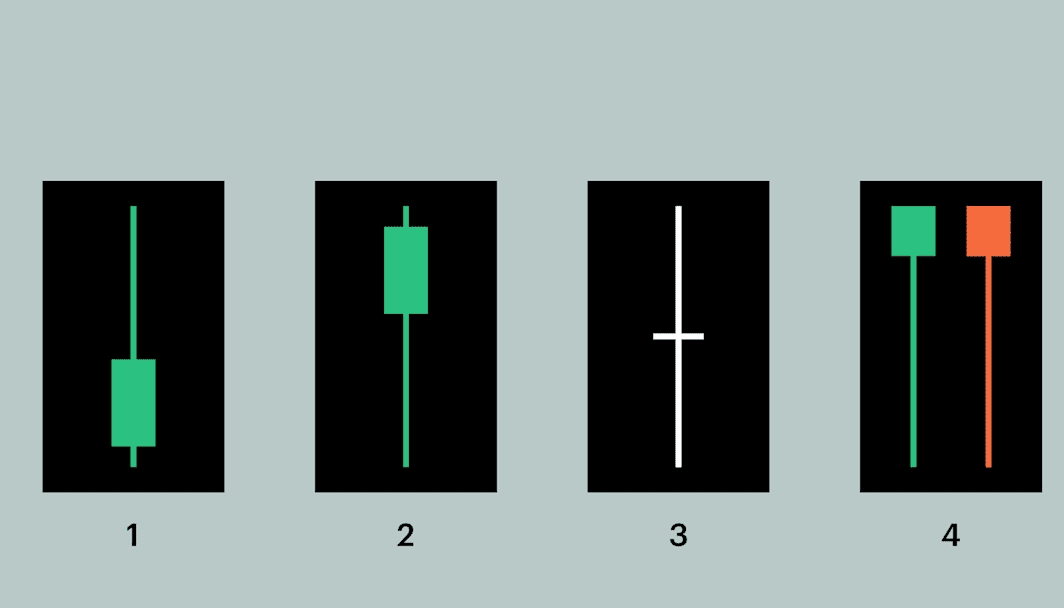
It is important to note that one candle signals can be an important clue, but an accurate reading of the market requires understanding the broader context. And detecting trends and patterns in candlestick charts is not easy. If you are unsure which investment strategy is right for you, consult with a professional advisor.
#HotJulyPPI #BTCBreaksATH #BNBBreaksATH #REVABinanceTGE #MarketGreedRising
