
Every trader wants to know what the whales are doing. While we can't read their minds, on-chain data gives us the next best thing: a transparent ledger of their actions. By analyzing two key metrics on CryptoQuant for the Tron (TRX) network, we can differentiate between high-frequency network utility and the massive capital flows of whales, giving us a powerful edge.
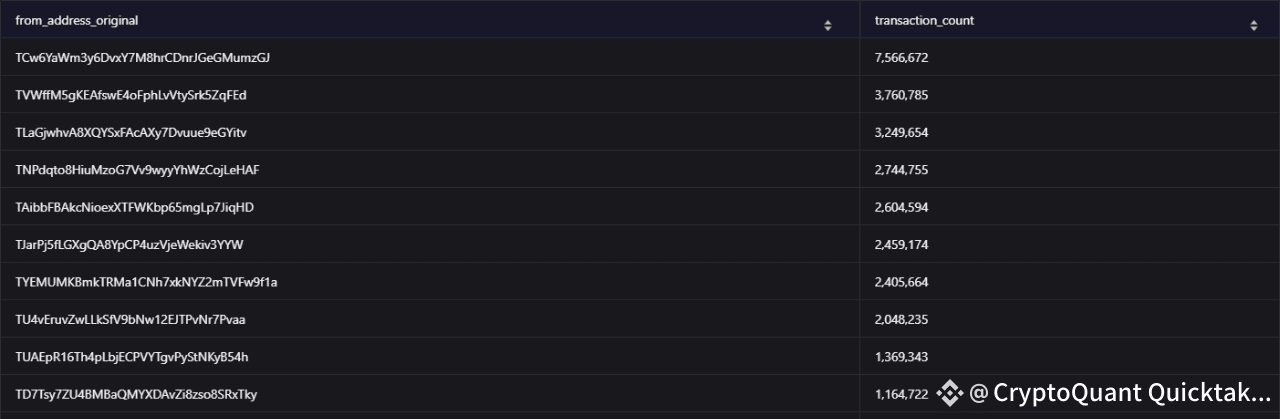
1. The Engine Room: Top Addresses by Transaction Count
The first metric reveals the network's operational core. The top address, TCv...mZt, has executed over 7.5 million transactions. This isn't typical investor behavior; it's the signature of a high-powered dApp, exchange, or smart contract system driving immense utility on the Tron blockchain. This high-frequency activity is the lifeblood of a healthy ecosystem, proving that Tron is a platform for building and transacting, not just speculating.
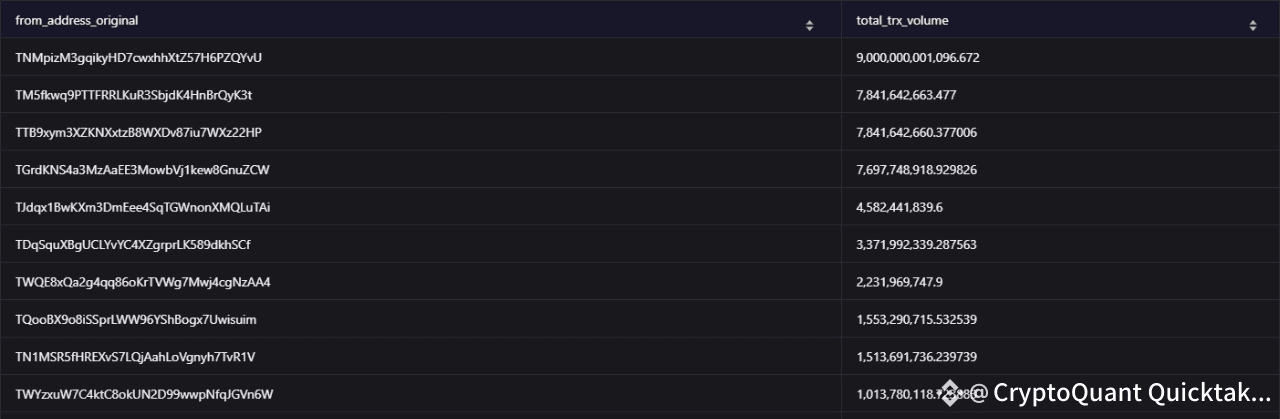
2. The Whales' Playground: Top Addresses by TRX Volume
The second metric shows us where the real financial weight is moving. The top address, TNm...vU, has moved a staggering 9 trillion TRX. These are not utility transactions; this is the movement of immense capital. These addresses represent the whales, institutions, and exchange wallets that provide deep liquidity to the network. Tracking the flow from these addresses is the closest an analyst can get to observing the market's "smart money" in real-time.
Actionable Insight:
By using these two CryptoQuant charts, you can achieve a dual-focus analysis of the Tron network:
Monitor "Top Addresses by Transaction Count" to gauge the health and growth of Tron's dApp ecosystem.
Track "Top Addresses by TRX Volume" to follow the whales and anticipate large-scale capital movements.
The data is clear: Tron is a network with both deep utility and massive liquidity. Use these tools on CryptoQuant to trace the titans of Tron and make more informed decisions.
Written by Crazzyblockk


